Aviation authorities across the world have reported a 4.1 percent increase in year-over-year airport passenger traffic for the month of September as well as a 3.1 percent increase from October 2012 to September 2013.
Despite overall airport passenger traffic growth not being as strong as previous years, demand is proving to be resilient.
The data comes from an article titled “Passenger Traffic Grows by 4.1% for the Month of September“.
This article provides an in-depth look at air passenger traffic growth in different regions of the world, plus a list of the world’s busiest airports.
Airport passenger traffic growth by geographic region
- Africa – due to political instability, Egyptian airports reported sharp declines in the number of air passengers. In fact, Cairo (CAI), North Africa’s busiest airport, experienced a 17.5 percent decline in passenger traffic for the month of September. Overall, there was a 7 percent decline in passenger traffic in Africa.
- Latin America-Caribbean – there was an increase of 6.3% over the previous month and 5% compared to September 2012. Mexico City rose by 8.6% and Bogota by 9%.
- Asia-Pacific – Asia-Pacific experienced a significant increase in passenger traffic, of 8.6 percent. The region’s busiest airport, Hong Kong (HKG), reported a 9.7 percent rise in the total number of international passengers.
- Europe – passenger traffic grew by 2.8 percent for Europe as a whole. Airports that were mainly affected by the economic crisis, including Madrid (MAD), Spain’s busiest airport, which reported a drop of 11.5 percent.
- Middle East – the Middle East experienced more growth in September compared to any other region (8.9 percent). Dubai (DXB), Tel-Aviv (TLV) and Abu Dhabi (AUH) grew by 13.1%, 12.4% and 10.1% respectively.
- North America – passenger traffic increased by 1.6 percent. Los Angeles (LAX) grew by 5 percent and has reported a significant rise in the number of passengers in transit.
| TABLE 1: SUMMARY WORLDWIDE TRAFFIC RESULTS, September 2013 (% CHANGE) | |||
| September 2013 over September 2012 |
Year to Date 2013 | 12-Month Rolling Year | |
| PaxFlash | |||
| International Passenger | 4.8 | 5.0 | 4.7 |
| Domestic Passenger | 3.3 | 2.2 | 1.6 |
| Total Passenger | 4.1 | 3.5 | 3.1 |
| FreightFlash | |||
| International Freight | -0.6 | -0.4 | -0.3 |
| Domestic Freight | -2.2 | 0.2 | 0.2 |
| Total Freight | -1.1 | -0.2 | -0.2 |
Airport passenger traffic affected by economic slowdown
ACI World’s Economics Director Rafael Echevarne said:
“With the slowdown in economic growth in both advanced economies and emerging markets, particularly with respect to China, it’s not surprising to see the uniform slowdown in air freight in these markets. Conversely, passenger traffic, has demonstrated a greater level of immunity to the downside risk exposure in the global economy and emerging markets.”
He concluded:
“Although certain markets continue to operate in an environment of persistent economic uncertainty, particularly with regards to the Euro area and North America, the budding middle class in many emerging markets acts to offset the slowdown in these other economies.”
The world’s busiest airports
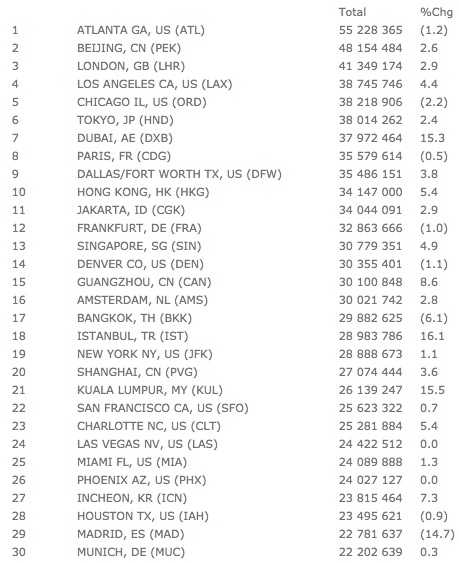
Airport passenger traffic – busiest airports. Jan-Jul 2013 (Source: ACI).