America’s richest get the most income growth, i.e. the top 1% wealthiest Americans captured 53.9% of all growth in the country between 1979 and 2007, according to a new study published by the Economics Policy Institute for the Economic Analysis and Research Network (EARN).
The study – “The Increasingly Unequal States of America: Income Inequality by State” – written by Mark Price and Estelle Sommeiller, analyzed state-level income trends from 1917 to 2011.
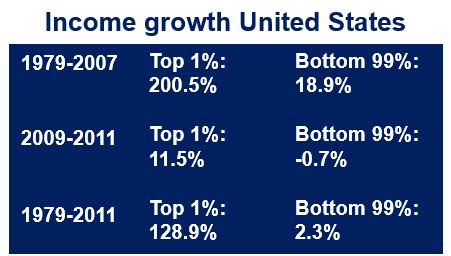
From 1979 to 2007, the incomes of the top 1% grew by 200.5%, compared to just 18.9% for the other 99% of the population, a more than tenfold difference.
The Great Recession pushed all incomes down, but since the recovery started in 2009 income growth has been lopsided again, with America’s richest, i.e. the top 1%, grabbing “an alarming share of the economic growth.”
(Source: Economic Policy Institute)
The US economy has failed most people for decades
Price, an economist at the Keystone Research Center, said:
“The levels of inequality we are seeing across the country provide more proof that the economy is not working for the vast majority of Americans and has not for decades. It is unconscionable that most of America’s families have shared in so little of the country’s prosperity over the last several decades.”
The authors concentrated on income inequality by states in 2011, the most recent year for available data.
The two states with the largest gap between the top 1% and the bottom 99% regarding incomes were New York and Connecticut. In both states the top 1% had average incomes approximately 40 times greater than the rest of the population.
Economists use the terms income gap and income inequality interchangeably.
Income inequality definitely not inevitable
Sommeiller, a socio-economist at the Institute for Research in Economic and Social Sciences in Greater Paris, France, said:
“Our study shows that this one percent economy is not just a national story but is evident in every state, and every region. Nevertheless, the fact that inequality in the United States declined for over four decades between the 1940s and the 1970s shows that there is nothing inevitable about the extreme levels of inequality we are currently seeing.”
Below are some highlighted data from the study:
- In Alaska, Michigan, Wyoming and Nevada, the average income of the bottom 99% declined between 1979 and 2007, and rose for the top 1%.
- The top 1% received between 50% and 84% of all income growth between 1979 and 2007 in the following fifteen states: In Arizona the top 1% captured 84.2% of all income growth, Oregon 81.8%, New Mexico 72.6%, Hawaii 70.9%, Florida 68.9%, New York 67.6%, Illinois 64.9%, Connecticut 63.9%, California 62.4%, Washington 59.1%, Texas 55.3%, Montana 55.2%, Utah 54.1%, S. Carolina 54%, and W. Virginia 53.3%.
- In the following ten states, the top 1% captured the smallest share of all income growth between 1979 and 2007: Louisiana 25.6%, Virginia 29.5%, Iowa 29.8%, Mississippi 29.8%, Maine 30.5%, Rhode Island 32.6%, Nebraska 33.5%, Maryland 33.6%, Arkansas 34%, and N. Dakota 34.2%.
Policies favor America’s richest
Doug Hall, director of the EARN program said:
“It’s clear that policies were set to favor the one percent and those policies can, and should, be changed. In order to have widespread income , bold policies need to be enacted to increase the minimum wage, create low levels of unemployment, and strengthen the rights of workers to organize.”