What is a Gantt chart? What is it used for?
A Gantt chart is a bar chart that Henry L. Gantt developed as a production control tool in 1917. The bars on the chart appear horizontally. It provides a graphical illustration of a schedule that helps in the coordination, planning, and tracking of specific tasks within a project.
People commonly use the Gantt chart in project management. In fact, it is one of the most useful and popular ways of showing tasks or events against time. Project management involves organizing, planning, and managing every component of a project.
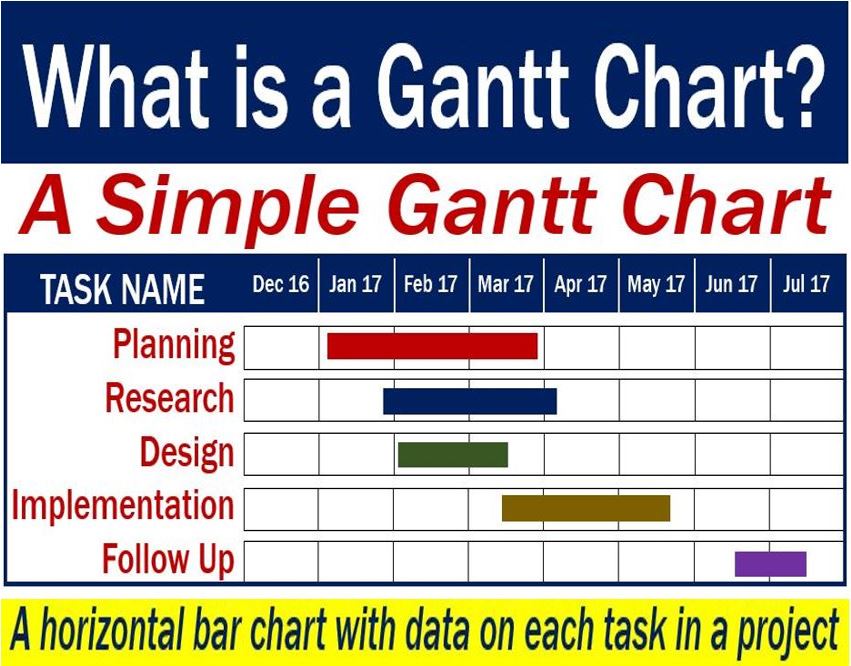
On the left side of the chart, there is a list of the activities. At the top, there is a suitable timescale.
Each bar represents an activity. The bar’s position and date reflect the activity’s start and end dates. The bar also tells us the duration of the activity.
Gantt chart – packed with data
Gantt.com says that the chart allows us to see the following at a glance:
- A list of all the activities.
- The starting and finishing dates of each activity.
- The scheduled duration of each activity.
- Whether activities overlap. If they do, it also tells us by how much.
- The whole project’s start and end dates.
Some charts also have detailed information on each task. Therefore, just by looking at the chart, you can get a good idea of the whole project.
Gantt chart – history
Karol Adamiecki, a Polish engineer, devised the first Gantt chart in the 1980s.
Henry Gantt, an American engineer and project management consultant, devised his own version. It was Gantt’s version that became famous and popular in western nations. Consequently, people started calling it the Gantt chart.
At first, preparing Gantt charts was a laborious affair. Every time a project changed, people had to redraw or amend the whole chart. This restricted its usefulness.
Today, however, thanks to computers and specialized software, we can create, update, and print Gantt charts easily.
People currently use the Gantt chart to track project schedules. For project managers, coordinators, and participants, it is useful to see additional data regarding each task.
For example, the chart tells us how far a task has progressed. It may also tell us what resources people are using for each task.
Video – A Gantt Chart
This Matchware Software video tells us how to build a Gantt chart with MindView.