A hockey stick chart shows a long flat period on a chart which precedes either a sharp decline or steep rise. The line chart has a hockey stick shape, i.e., long and flat and then suddenly turning. What follows the flat period depends on which way up or down you position the stick.
If the tip of the hockey stick blade points up, the stable period precedes a sharp rise. If it points down, on the other hand, a steep decline follows the stable period.
Effective in presentations
When making a presentation in which you want to propose drastic action, a hockey stick chart is effective. It is effective because everybody can visualize what has been or will be happening.
People tend to use this kind of chart to show a gradually rising period followed by a dramatic upswing. However, presenters and statisticians also use it to show a sharp fall.
According to the Financial Times’ glossary, ft.com/lexicon, the term refers to:
“The shape of a graph where one variable rises steadily over a period of time and then dramatically increases towards the end of the period.”
“The shape resembles an ice hockey stick blade.”
If the sudden upward or downward shift occurs over a short period, it is crucial determine why. In other words, is it the result of a fundamental change or something else?

Hockey stick chart – Climategate
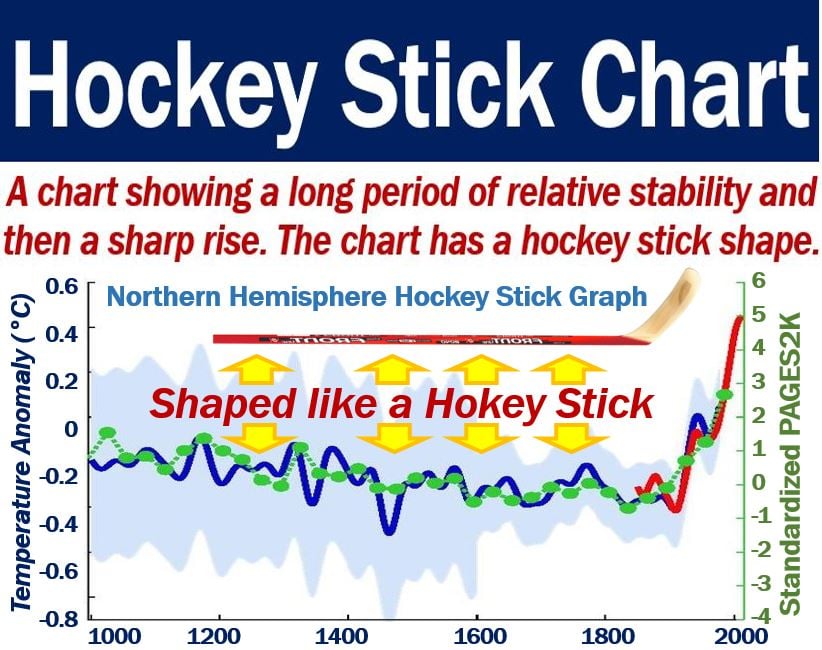
Jerry Mahlman (1940-2012), an American meteorologist and climatologist, coined the term ‘hockey stick’ for charts in 1999.
Mahlman used the term to describe Mann, Bradley and Hughes’ global climate pattern. The graph showed a relatively flat downward movement until 1900, and then a sharp rise. In other words, it appeared to be compelling evidence of global warming.
The graph looked like a hockey stick with the blade section at the end pointing upward.
In fact, the graph later formed part of the ‘Climategate’ email scandal. Climategate appeared to show scientists manipulating data.
Despite the Climategate scandal, subsequent studies have produced compelling evidence that our planet is getting warmer. In fact, it will probably continue warming up dangerously if we do not take drastic action.
Michael Le Page wrote the following in a 2007 article in the New Scientist:
“In fact, later studies support the key conclusion: the world is warmer now than it has been for at least 1000 years.”
Video – Hockey stick chart
In this GreenManBucket video, Michael Mann talks about the hockey stick chart. Mann is Director of the Earth System Science Center at Pennsylvania State University.