What is the Laffer Curve? Definition and meaning
The Laffer Curve was a sketch drawn by economist Arthur Laffer in 1974 on a napkin in a restaurant in Washington D.C. The curve showed that initially, higher tax rates increased government revenue, but when they were raised too high revenues would decline for a number of reasons, partly because they discouraged people from working or encouraged rich people to become tax exiles. The Laffer Curve became an icon in **supply-side economics.
** Supply-side economics focuses on boosting supply to trigger economic growth and greater employment, as opposed to Keynesian policies, which boost demand.
Supporters of what the Laffer Curve suggests, say that when taxes reach a certain point, people and companies’ motivation to work and or invest declines, which means that less wealth (income) is created – or that wealth is created abroad – leading to reduced income for the government in the form of taxes.
Governments should reduce their tax rates when they have reached this point, for two reasons: 1. To boost their tax revenues. 2. So that the economy can grow.
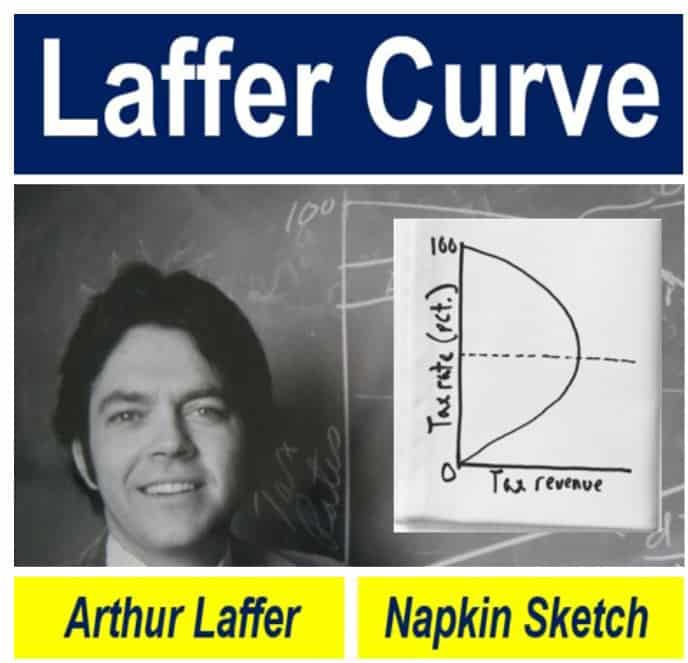
It all started when economist Arthur Laffer (above) was explaining to his dinner companions that tax rates can be pushed so high that government revenue declines. He drew a graph an a cloth napkin (above) to illustrate the point he was trying to make. (Image: adapted from laffercenter.com)
The Laffer Center, at the Pacific Research Institute in San Francisco, California, made the following comment regarding the Laffer Curve definition:
“As drawn, the Laffer Curve shows that at a tax rate of 0%, the government would collect no tax revenue, just as it would collect no tax revenue at a tax rate of 100% because no one would be willing to work for an after-tax wage of zero.”
“The Laffer Curve is one of the main theoretical constructs of supply-side economics, and is often used as a shorthand to sum up the entire pro-growth world view of supply-side economics.”
The Laffer Curve – created in 1974
In 1974, President Gerald Ford’s top White House advisers, Donald Rumsfeld and Dick Cheney had gathered at the Two Continents restaurant in Washington with Arthur Laffer, former chief economist at the Office of Management and Budget, and Jude Wanniski, a Wall Street Journal editorial writer.
The US was in the middle of a severe recession, and Laffer was lecturing to the others at the table that the federal government’s marginal tax rate of 70% was grinding the economy to a halt.
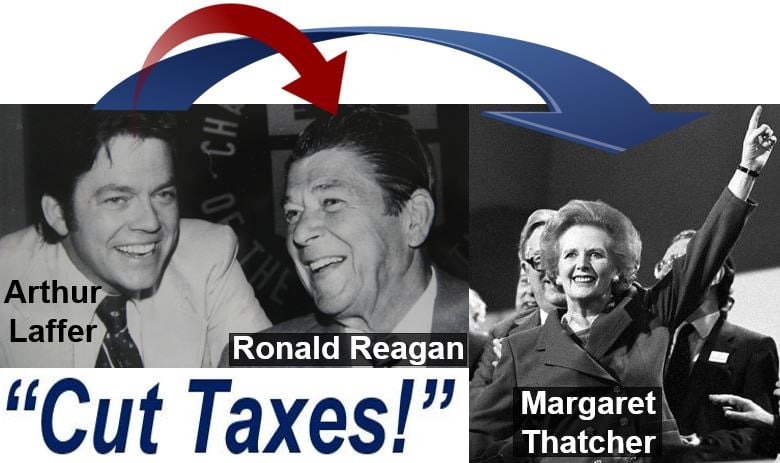
Arthur Laffer was a member of President Ronald Reagan’s Economic Policy Advisory Board from 1981 to 1989. He advised President Reagan, as well as British Prime Minister Margaret Thatcher, to slash taxes in order to boost the economy. (Image: adapted from: potus-geeks.livejournal.com)
Laffer grabbed a cloth napkin and a pen and drew a chart illustrating that when tax rates are pushed too high, they penalize investment and work and can actually trigger revenue losses for the government.
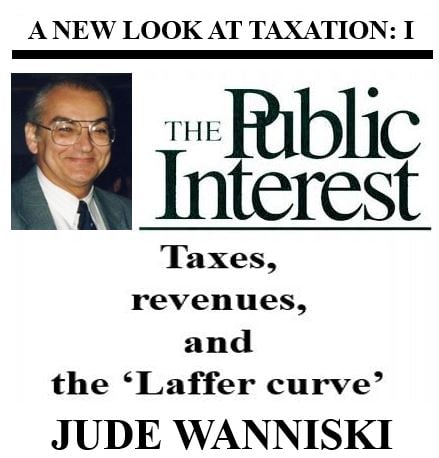
In 1978, Wanniski immortalized the napkin as the Laffer Curve in an article written for The Public Interest magazine.
Laffer curve challenged Keynesian economists
Since World War II, nobody had challenged the orthodoxy of Keynesian economics, that a government could spend its way out of a recession by taxing more and stimulating demand, that is, until the 1974 Laffer Curve moment and Wanniski’s immortalization of it four years later..
According to Laffer’s model, the problem is rarely demand, but rather the obstacles in the form of high taxes and mountains of regulations, which undermine people’s and companies’ ability and willingness to produce goods and deliver services efficiently and profitably.
At the end of the 1970s and the beginning of the 1980s, when Ronald Reagan and Margaret Thatcher headed the US and British governments respectively, a growing number of economists and politicians argued that the Laffer Curve proved that most governments could increase tax revenue and boost GDP (gross domestic product) growth by slashing tax rates.
When he was President, Ronald Reagan recalled that as an actor in Hollywood, once he had hit the Federal Government’s top tax band, he would stop making movies.
Laffer Curve criticized
Like any theory that becomes famous, the Latter Curve and its supply-side message have been criticized by economists across the globe since their birth four decades ago.
Many in the media have labelled it ‘voodo economics‘ and ‘trickle down economics’. Some mainstream economists have disparaged it in texts as theories belonging to ‘charlatans and cranks’.
In 2013, Pope Francis wrote that the Laffer Curve has never been supported by facts and relies on “a crude and naive trust in the goodness of those wielding economic power and in the sacralized workings of the prevailing economic system.”

Sephen Moore, Chief Economist at the Heritage Foundation and co-author with Arthur Laffer of An Inquiry into the Nature and Causes of the Wealth of States, wrote in an article in the Washington Post:
“I’d argue – and not just because Laffer has been a longtime friend and mentor — that his theory has actually held up pretty well these past 40 years. Perhaps its critics should be called Laffer Curve deniers.”
In 1989, when President Reagan left the White House, America’s top rate of tax had been reduced from 70% in 1981 to 29%. Contrary to ‘voodoo economics’ claims, federal government revenue grew from $517 billion in 1980 to $909 billion in 1988 – an increase of nearly 75%, or 25% in real terms (after allowing for inflation).
During that period, tax collections for rich individuals had surged considerably faster than those from the rest of the population.
Video – What is the Laffer Curve?
This interesting video, from our sister channel in YouTube – Marketing Business Network, explains what the ‘Laffer Curve’ is using simple and easy-to-understand language and examples.