What is regression analysis? Definition and examples
Regression analysis, in statistical modeling, is a way of mathematically sorting out a series of variables. We use it to determine which variables have an impact and how they relate to one another. In other words, regression analysis helps us determine which factors matter most and which we can ignore.
It also helps us determine which factors interact with each other. Furthermore, and most importantly, it helps us find out how certain we are about all the factors we are examining.
Goodness of fit, for example, is a component of regression analysis. Goodness of fit refers to how accurate expected values of a financial model are versus their actual values.
Regression analysis – a statistical measure
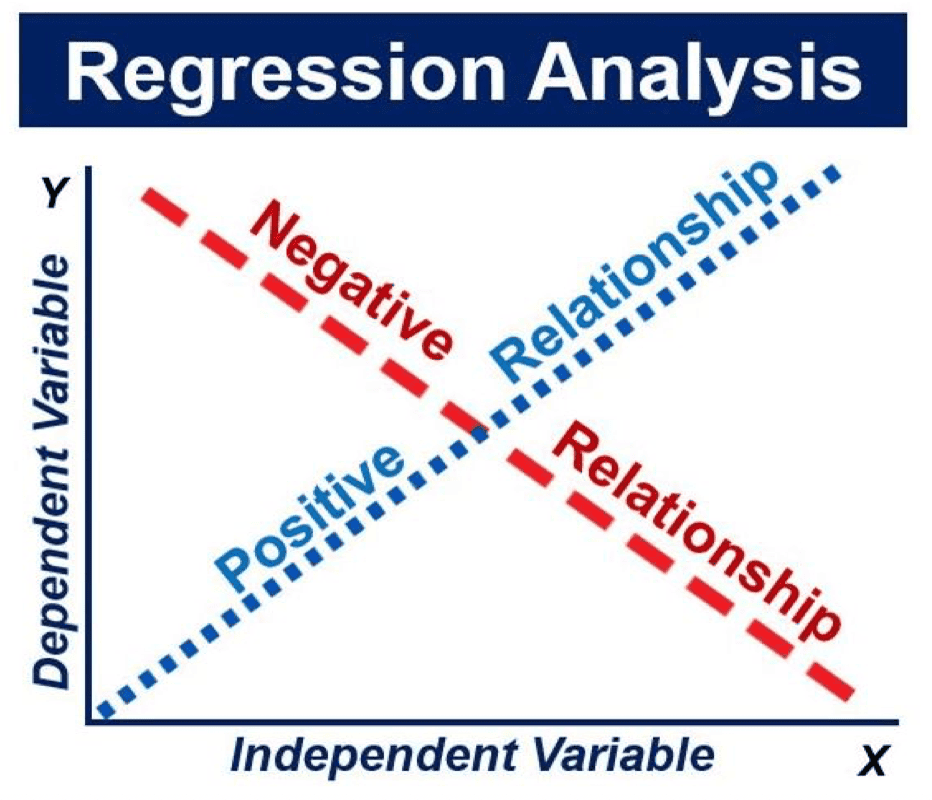
Regression analysis is a statistical measure that we use in investing, finance, sales, marketing, science, mathematics, etc. It tries to determine how strongly related one dependent variable is to a series of other changing variables. We usually refer to them as independent variables.
The dependent variable is the one that we focus on. Put simply, we want to know whether it is being affected, and if so, by how much, and by what.
Independent variables are the factors that may or may not affect the dependent variable. Dependent receives the impact, while Independent provides (or not) the impact.
Financial and investment managers say that it helps them value assets. It also helps them understand the relationships between different variables. For example, how the price of commodities relates to the shares of companies that deal in those commodities.
Regression analysis in sales
Imagine you are a sales manager and you are trying to predict next month’s figures. You know that there are dozens that can impact the number. For example, the time of year or rumors that a better model is coming out soon can impact the number. In fact, there may be hundreds of factors.
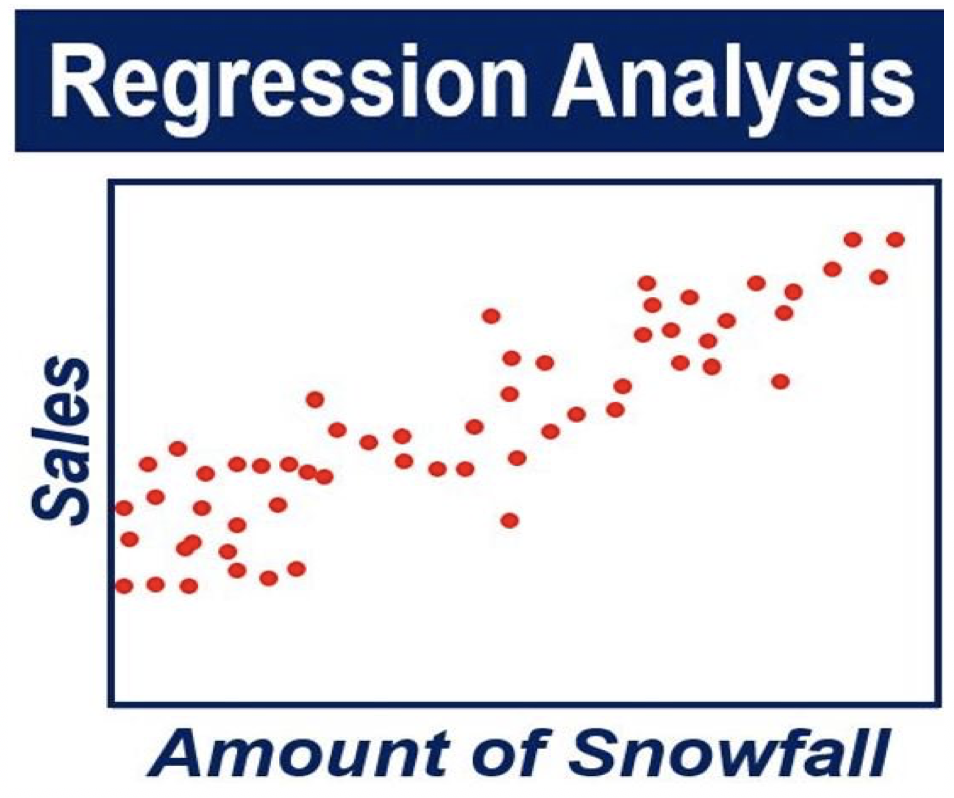
Maybe work colleagues add their own variables to the mix. They might say, for example, that when it snows the company sells more. Others, on the other hand, may comment that sales take a nosedive about six weeks after a competitor’s promotion.
Regression analysis helps us determine which factors really matter and their relationships. It also helps us find out what their effects are on sales figures.
Variables
We call all these factors variables. There is a dependent variable, i.e., the main factor that we are trying to predict or understand. In your case as the sales manager, the dependent variable is monthly sales.
There are also independent variables; these are other factors which you believe may potentially have an impact on the dependent variable.
For your regression analysis, you have to gather all the information on the variables. You collect all data on your monthly sales numbers for the past quarter, half year, year, or three years. You also gather any data on the independent variables that you want to consider.
Regression analysis – example
For example, if you think snow might impact sales, you will need snowfall data for the past three years. You then plot all that information on a graph.
In an article published in the Harvard Business Review in November 2015, – A Refresher on Regression Analysis – Amy Gallo wrote:
“Most companies use regression analysis to explain a phenomenon they want to understand (e.g. why did customer service calls drop last month?); predict things about the future (e.g. what will sales look like over the next six months?); or to decide what to do (e.g. should we go with this promotion or a different one?).”
According to BusinessDictionary.com, regression analysis (RA) by definition is:
“Statistical approach to forecasting change in a dependent variable (sales revenue, for example) on the basis of change in one or more independent variables (population and income, for example).”
“Known also as curve fitting or line fitting because a regression analysis equation can be used in fitting a curve or line to data points, in a manner such that the differences in the distances of data points from the curve or line are minimized.”
History of regression analysis
French mathematician Adrien-Marie Legendre (1752-1833) published the earliest form of regression that we know of in 1805. German mathematician Johann Carl Friedrich Gauss (1777-1855) also published a piece in 1809.
Both mathematicians wrote about the ‘method of the least squares.’ The method of the least squares is a standard approach in regression analysis when there are more equations than unknowns.
Gauss and Legendre applied the method to the problem of finding out what the orbits were of various celestial bodies. They focused mainly on the orbits of comets around the Sun.
In 1821, Gaus published an additional development to the theory of least squares in 1821. He included a version of what we call the Gauss-Markov theorem.
Sir Francis Galton (1922-1911), a British statistician, coined the term Regression Analysis in the 19th century. He used the term when describing people’s heights through generations. His study showed that the heights of descendants of very tall ancestors tended to move downward towards a normal average. In fact, we call this a regression toward the mean.
Galton believed that regression was only applicable when he used it to describe the biological phenomenon that he had discovered.
However, Karl Pearson (1857-1936) and George Udny Yule (1871-1951) extended his work to a more general statistical context.
By the middle of the 20th century, economists were using electromechanical desk calculators for regression analysis calculations. Up to 1970, it could take up to twenty-four hours to obtain the result from one regression.
Today, people are still actively researching regression methods. Over the past few decades, statisticians have developed new methods for:
Robust Regression
This is regression involving responses that correlate, such as growth curves and time series.
More Complex Regression
This includes regression in which the independent variable (the predictor) or response variables are images, curves, or graphs.
Methods that Address Data Problems
Examples include Bayesian methods for regression, non-parametric regression, regression with a greater number of predictor variables than observation. Other examples include regression in which the predictor variables are incorrectly measured and causal inference with regression.
Video – Regression Analysis
In this Statistics is Fun video, the tutor explains what regression analysis is using simple language and easy-to-understand examples.