What is seasonally adjusted? Definition and meaning
Seasonally adjusted refers to statistics that have removed the fluctuating component of a time series that has a seasonal pattern, such as children’s toy sales, which rise during the eight weeks leading to Christmas, and construction, tourism, and ice-cream sales, which increase during the warmer months of the year and decline during the winter months. The data is seasonally adjusted when statisticians, economists, civil servants, lawmakers, and business managers want to analyze the trend – and cyclical deviations from a trend – of a time series independently of the seasonal fluctuations that already exist.
When you want to find out what the underlying trends are, statistics that reflect just part of the year are typically adjusted – seasonally adjusted – to iron out the seasonal factor.
For example, the sales of men’s shorts during the summer months always exceed winter sales volumes considerably. In order to get a clear picture of the general trend in the men’s shorts market, the data needs to be seasonally adjusted.
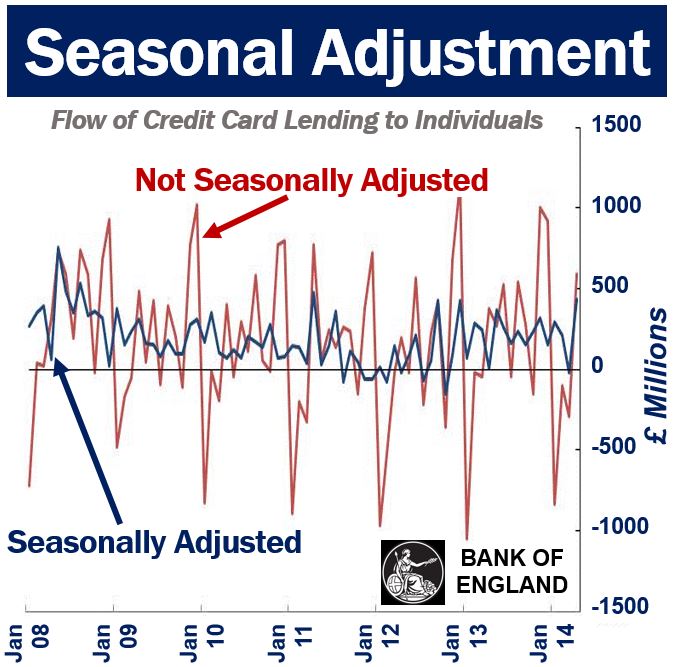 According to the Bank of England: “Data users are often interested in series which have been adjusted to remove seasonal effects, since these may give a better indication of the underlying movements. For those series where identifiable seasonality is detected, a seasonally adjusted version is also published. The seasonally adjusted flows for credit card lending to individuals (blue line below), removes both the regular seasonal movements and any calendar effects.” (Image: adapted from bankofengland.co.uk)
According to the OECD (Organization for Economic Cooperation and Development):
“Seasonal adjustment is a statistical technique to remove the effects of seasonal calendar influences operating on a series. Seasonal effects usually reflect the influence of the seasons themselves either directly or through production series related to them, or social conventions.”
“Other types of calendar variation occur as a result of influences such as number of days in the calendar period, the accounting or recording practices adopted or the incidence of moving holidays (such as Easter).”
Seasonally adjusted labor force statistics
The US Bureau of Labor Statistics says that its figures are seasonally adjusted in an attempt to measure and remove influences of predictable seasonal patterns to show how unemployment and employment change from one month to the next.
The Bureau of Labor Statistics writes:
“Over the course of a year, the size of the labor force, the levels of employment and unemployment, and other measures of labor market activity undergo fluctuations due to seasonal events including changes in weather, harvests, major holidays, and school schedules.”
“Because these seasonal events follow a more or less regular pattern each year, their influence on statistical trends can be eliminated by seasonally adjusting the statistics from month to month. These seasonal adjustments make it easier to observe the cyclical, underlying trend, and other non-seasonal movements in the series.”
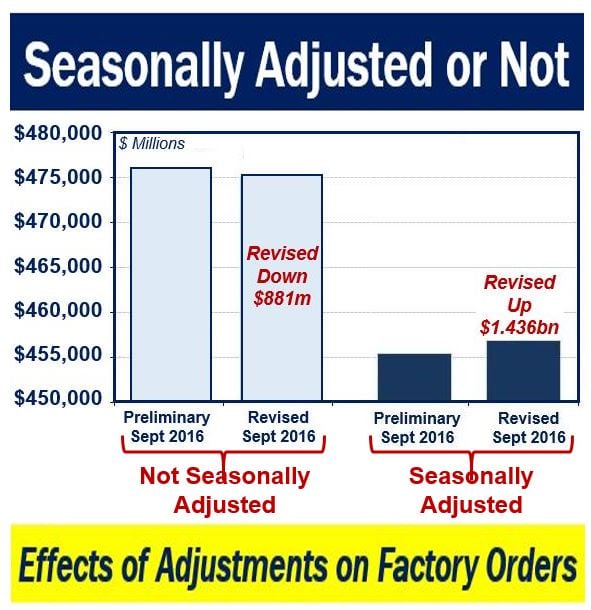 In an article on the Seeking Alpha website, Jeffrey Snider explains that revised unadjusted figures can move in a downward direction while revised seasonally adjusted figures can move in an upward direction for the same month. (Image: Adapted from seeking.alpha.com)
Most of the data that the US government and those of the majority of other countries report in the news are seasonally adjusted.
When comparing several months of data, it is more useful to seasonally adjust them beforehand, you can then rapidly determine whether there has been real growth or decline.
House sales data seasonally adjusted
We all know that house sales in January and February are lower than in May and June. Most people delay house-hunting until spring, and house sellers wait until house-hunting starts before putting their homes on the market.
Given the cyclical and predictable pattern in the housing market, analysts want to seasonally adjust the data so that they can spot moves that are not due to the month of the year – they want to determine whether a more macroeconomic issue is having an impact on home sales, such as a housing glut or shortage, a slowing or expanding economy, interest rate fluctuations, etc.
Let’s say the analyst has twenty years’ worth of monthly home sales data. Every year, the pattern is virtually the same – in January and February sales volumes drop by 20%, while in May and June they rise by 20%, compared to the average per month for that year.
If 80,000 houses were sold in January, and January sales are typically 20% lower than the average per month, analysts will say that they have a seasonally adjusted rate of 100,000 home sales per month, which equals 1.2 million sales per year.
Regarding these home sales data, in an article published in Mathbabe in June, 2011 – What is Seasonal Adjustment? – Cathy O’Neil wrote:
“Note that this system of adjustment follows the golden rule at least for the historical data; by the end of each calendar year, we have attributed the correct overall number of sales, spread out over the months.”
“However, if we start predicting July sales from what we’ve seen from home sales from January to March, taking into account these adjustments, we will also be tacitly assuming an overall number of sales for the year, and the golden rule will probably not hold.”
“This is just another way to say that we won’t really know how many home sales have occurred in a given year until the year is over, so duh. But it’s not hard to believe that knowing these numbers is pretty useful if you want to make a ballpark estimate of the yearly rate of home sales and it’s only March.”
Critics of seasonal adjusted data say that most models do not tell us how many years of data were used when making the adjustment.
 Wayne Arthur Fuller is an American statistician who specializes in survey sampling, econometrics and time series analysis. He has worked at Iowa State University since 1959, and became a Distinguished Professor in 1983. (Image: adapted from: news.iastate.edu)
Standardizing seasonal adjustment processes
If organizations, companies, governments or nations adopt different seasonal adjustment practices, there is chaos. Whenever people analyze charts that have been produced and seasonally adjusted outside their circle of influence, they will most likely misinterpret the data.
To overcome this global problem, Eurostat, the statistical office of the European Union (EU), and the European Central Bank started a movement to promote a standardized process.
A small group – consisting of experts from statistical institutions and central banks from across the EU – produced the 2009 ESS Guidelines on Seasonal Adjustment.
The guidelines have been adopted by all statistical agencies and institutions within the EU. They are also being adopted by a rapidly-growing number of public and private statistical institutions outside the EU.
In the Introduction of the Guidelines document, Eurostat writes:
“In an effort to promote the idea of best practices in seasonal adjustment, the European Statistical System (ESS) and Central Banks with significant statistical departments have produced a set of guidelines to assist all levels of seasonal adjustment practitioners from novices to experts.”
“These guidelines focus the technical framework on two approaches: TRAMO-SEATS (supported by Banco de España) and X-12-ARIMA (supported by the Bureau of Census in the US) which are the most commonly used within the ESS. This document does not discuss their relative merits as both can be considered equally valuable (as is reflected in their widespread use).”
“The guidelines are not just restricted to the seasonal adjustment alone, they also cover the pre-treatment of series, revision policies, quality, documentation and specific issues related to limitations of seasonal adjustment, e.g. short time series.”
Video – Fun with seasonal adjustment
In this video, Jodi Beggs talks about the US Bureau of Labor Statistic’s seasonally adjusted and not seasonally adjusted numbers in their regular reports. She presents a simple example to explain the logic behind seasonal adjustment.