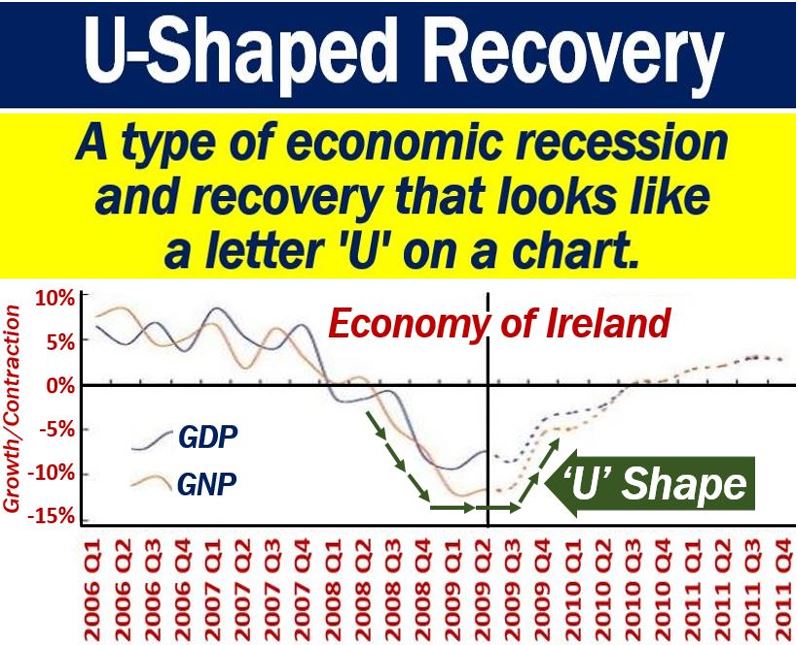
A U-shaped recovery or U-shaped recession is an economic period that we see on a graph. It describes an economic ‘recession and then recovery’ that looks like the letter ‘U.’ At the end of the recession, the decline is more gradual, i.e., less severe. The recovery that follows starts off moderately and then picks up speed.
Typically, we see a U-shaped recovery in specific economic measures, such as unemployment and industrial output. We also see it on a GDP growth chart.
GDP stands for Gross Domestic Product, which represents all the goods and services that a country produces.
Bankpedia.org has the following definition of the term:
“A type of economic recession and recovery that resembles a “U” shape in charting.”
“Specifically, a U-shaped recovery represents the shape of the chart of certain economic measures, such as employment, GDP and industrial output.”

U-shaped recovery and other shapes
Economists use shapes to describe different kinds of recessions. Even though there is no specific academic classification system for recession shapes, we have informal terminologies.
The terms we use include certain capital letters in the alphabet, i.e., V, U, W, and L.
V-shaped recovery
In a V-shaped recovery or V-shaped recession, the economy experiences a sharp decline. However, it is also a brief period of decline..
There is a clear trough which does not last long. Then there is a strong recovery.
Most periods of ‘recession and then recovery’ follow this V-shape.
The best example of a V-shaped recession was one that the United States experienced in the early-to-mid 1950s.
W-shaped recovery
We also call a W-shaped recovery or W-shaped recession a double-dip recession or double-dip recovery.
The economy sinks into a recession and then recovers. However, the recovery is brief. Then, the economy slips into another recession and finally recovers. This down-up-down-up movement gives the chart a ‘W’ shape.
The recessions in the US in the early 1980s, for example, created a ‘W’ shape on a graph, i.e., they depicted a W-shaped recession.
U-shaped recovery
A U-shaped recovery covers a longer period than a V-shaped one. The U-shaped recovery also has a less-clearly defined trough.
While the V-shape chart has a pointed trough, the U-shaped chart’s is smoother and rounder. Therefore, troughs are longer in U-shaped recoveries.
In this type of chart, GDP may contract for several quarters. Only after several quarters does GDP growth begin to pick up again.
Regarding a U-shaped recovery, Simon Johnson, former Chief Economist for the IMF, once said they were like bathtubs. Johnson said:
“You go in. You stay in. The sides are slippery. You know, maybe there’s some bumpy stuff in the bottom, but you don’t come out of the bathtub for a long time.”
The best example of a U-shaped recovery in the US was during the 1970s. Both inflation and unemployment were high for several years.
L-shaped recession
An L-shaped recession is every economist’s nightmare. In theory, we should not call it an ‘L-shaped recovery,’ because there is no recovery. However, people do.
The letter ‘L’ goes straight down and never comes back up again.
Imagine an economy that slides into a severe recession, then goes flat at the bottom, but never recovers. That is what an L-shaped recession does.