What is a statistician? Definition and meaning
A statistician is concerned with collecting, analyzing, interpreting and presenting quantitative data. He or she might work in a wide range of sectors such as finance, government, education, health, forensics, sport, astronomy, market research, or transportation.
A statistician designs and manages experiments and surveys, and deals with the preliminary gathering of data. They process and analyze the data in context, and will try to find patterns to help people make decisions.
Statisticians report their findings and advise what strategy or strategies are best for given situations.
Depending on the size of the company or organization, statisticians generally work in teams, alongside professionals of other disciplines.
They must have strong IT and analytical skills. They must also have good communication and interpersonal skills, given that they have to share their findings with colleagues, senior management and clients, and are expected to offer advice.
The US Bureau of Labor Statistics says that statisticians: “Use statistical methods to collect and analyze data and to help solve real-world problems in business, engineering, healthcare, or other fields.” (Image: bls.gov)
Statistician – duties
Statisticians gather, analyze and interpret numerical data and report their results to their clients. They frequently do so with the aid of software or mathematical techniques.
If their clients or whoever they are advising or presenting to are not statisticians, they must explain the complex statistical concepts in a way that is easily understood by lay people, as well as advising on strategy.
From weeks to years
Some of their studies or trials may be completed in a question of weeks or months. Others, on the other hand, might take several years.
For example, statisticians working in teams that study climate change may gather and analyze data spanning hundreds and even thousands of years. They may also have to wait a long time to determine what the current climate trends are or will be.
Statisticians should know how to present their data to non-specialized people, i.e., explain in lay terms.
According to prospects.ac.uk, a statisticians’ general tasks may include:
- Interviewing clients and agreeing on what information to gather and how it should be collect – taking into account any legislative and ethical considerations.
- Designing and creating experiments, trials and surveys in order to get the required data.
- Gathering and studying the data.
- Interpreting the collected and analyzed data and ensuring that the right decisions are based on the study findings.
- Monitoring all the collected data throughout its shelf-life.
- Presenting results to clients, senior managers, regulatory authorities, other departments, etc.
- Presenting and explaining results to policymakers and providing advice.
- Carrying out research, typically as a member of a team.
- Writing reports, abstracts, and perhaps articles for publication.
- Presenting findings at conferences in the home country and possibly abroad.
Planning to be a statistician?
Your work will most likely be in an office, although you may have to travel, sometimes regularly. You may need to travel to attend meetings with other stakeholders.
You might also have to travel to conferences at home and abroad.
Statisticians should expect to have to operate as a member of a multidisciplinary project team. Some statisticians work for themselves, i.e., they are self-employed.
Self-employed professionals generally work in a consultancy role, as is commonly the case in forensics.
In this context, ‘forensics’ refers to the application of technical or scientific methods to try to solve a crime.
Strong demand for statisticians
In most countries across the world, statisticians are in strong demand, and in many different fields. This is especially the case in the UK, USA, Canada, Ireland, Australia, and New Zealand.
Regarding job and career prospects for a statistician, The World of Statistics says:
“In recent years, there has been tremendous growth in interest in statistics by students in secondary schools and universities as well as by businesses and governments in countries around the world.”
“The demand for statisticians and their analytical skills continues to grow, and this trend shows no signs of slowing.”
Employers generally look for graduates with a degree in statistics, or another subject with a statistical or quantitative component, such as economics, geography, mathematics or psychology.
Statisticians – many fields
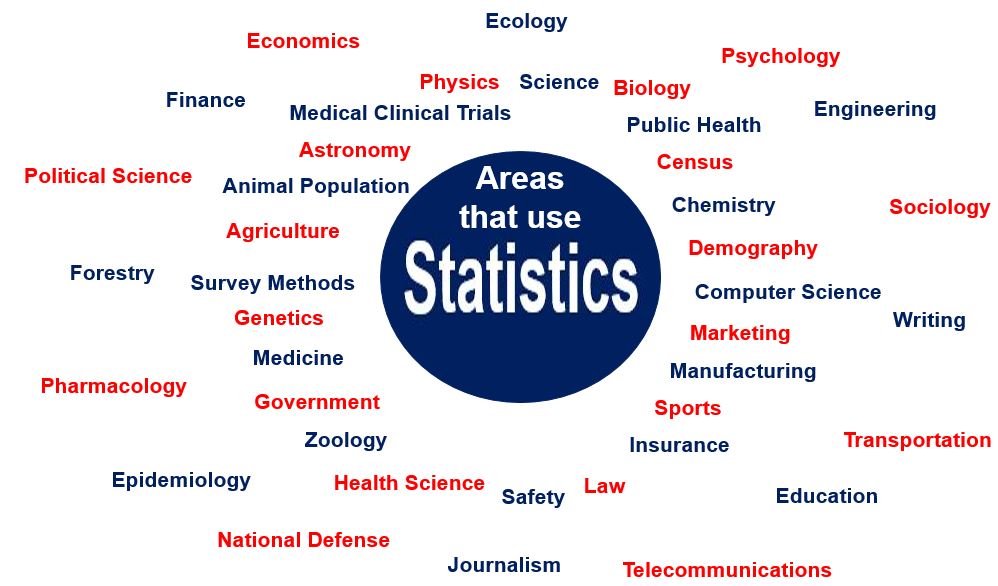
According to The World of Statistics, statisticians are lucky in that they can combine their interest with almost any other field of science, technology or business, including:
Zoology, Transportation, Telecommunications, Survey Methods, Sports, Sociology, Science Writing and Journalism, Safety, Public Health, Psychology, Political Science, Physics, Pharmacology, National Defense, Medicine, Medical Clinical Trials, Marketing, Manufacturing, Law, Insurance, Health Science, Government, Genetics, Forestry, Finance, Epidemiology, Engineering, Education, Economics, Ecology, Demography, Computer Science, Chemistry, Census, Biology, Astronomy, Animal Population, and Agriculture.
Florence Nightingale – a statistician
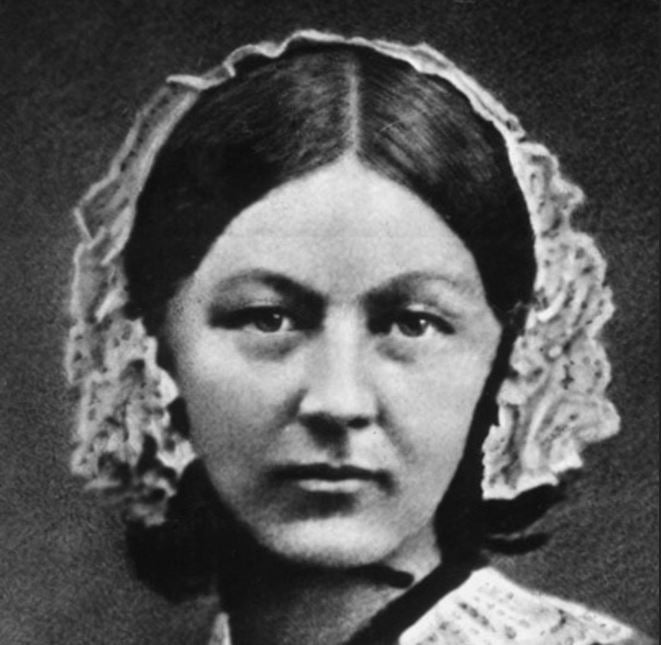
Florence Nightingale used statistics to gain insight into what was needed to improve the health and outcomes of patients in military hospitals. She was the driving force behind health reforms in Britain during the 19th century. (Image: biography.com)
Celebrated English social reformer, statistician, and the founder of modern nursing, Florence Nightingale (1820-1910), a member of the Royal Statistical Society, was a pioneer in gathering statistics on health policy.
Writing in the JMP Blog, Laura Lancaster explains that Nightingale was a pioneer for women statisticians.
Her extensive work led to health care policy reforms in 19th-century Britain. Her work subsequently saved the lives of many thousands of British soldiers.
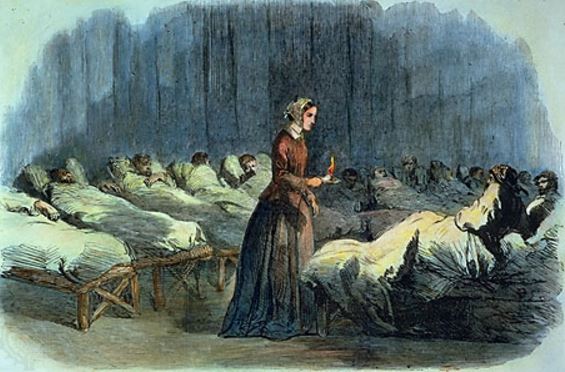
The Secretary of War, Sidney Herbert, recruited Nightingale to assemble a team of nurses to serve at the British hospital in the Crimea at Scutari.
When she arrived at the hospital, she described conditions as ‘squalid.’ Staff members worked too many hours, hygiene was poor, and a there was lack of food and supplies.
Organizing data collection and analysis
She worked hard at improving the conditions of the hospital. Nightingale also organized the chaotic hospital records into a well-systematized structure. It subsequently became easier to collect and analyze data.
In 1856, when she left Crimea, conditions of the hospitals in the area had improved considerably. Death rates, for example, had declined from 42% to just 2%.
Back in Britain, she asked Queen Victoria to appoint a Royal Commission on the Health of the Army. She wanted to gather and analyze the data so that people could use it for medical reform policies.
William Farr
To help her analyze all the data she had collected, she turned to William Farr (1807-1883). Farr, an epidemiologist, was a leading British statistician and founder of medical statistics.
After analyzing the statistical data from the Crimea, she made a remarkable discovery. The high mortality rates were due to the unsanitary living conditions that led to diseases. They were not, therefore, due to the lack of food and supplies as she had originally concluded.
Nightingale and Farr also found that the problems in British hospitals were present in peacetime. In peacetime, soldiers died at twice the rate of their civilian counterparts (aged 25 to 35).
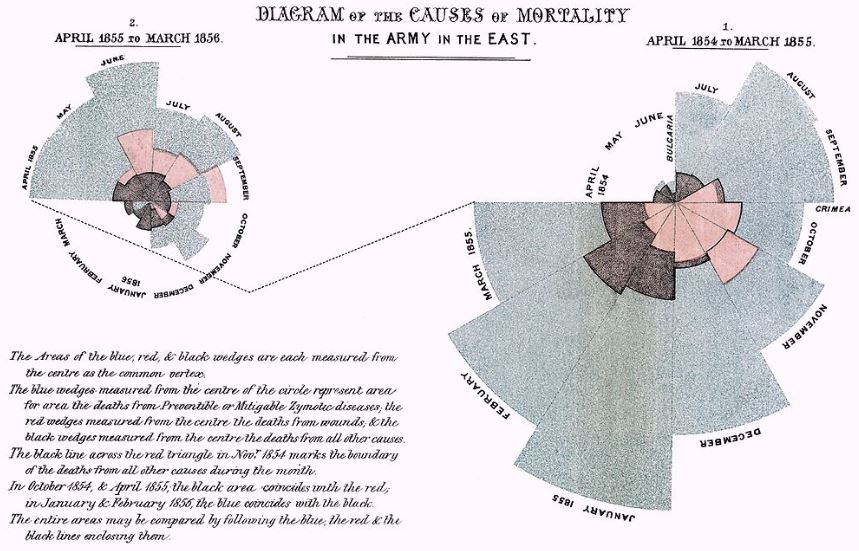
Presenting data to the Queen and MPs
Her next problem was to present all her statistics to Queen Victoria and MPs (Members of Parliament). She had to do this in lay terms. Otherwise, they would probably not understand it. They needed to understand the data and findings in order to push through reforms.
She created a clever graphical presentation of the statistical findings called a polar area diagram. We also refer to it as a ‘coxcomb.’
Presenting to lay people
Partly due to her use of statistics, she was able to present results in a way lay people could understand.
Nightingale became the driving force behind health reforms in 19-century Britain. She was also the driving force behind reforms in military hospitals in its colonies.
In 1858, she was elected as a Fellow of the Royal Statistical Society for her work on army. They also elected he for her work on hospital statistics and sanitation reform.
Nightingale was first woman to join the society. In 1874, she became an honorary member of the American Statistical Association.
Florence Nightingale died on 13th August 1910, aged ninety. She left a legacy of literally hundreds of thousands of surviving patients and medical reform.