What is the Yield Curve? Definition and Meaning
The yield curve is a curve that plots the yields or interest rates for a certain debt contract with different maturity dates. We often refer to it as ‘term structure of interest rates.’
The curve reveals the relationship between the interest rate and the time to maturity of a security. It allows investors to compare the yields offer that short-term, medium-term and long-term bonds offer.
A bond yield curve looks at bond yields and their relationships over time for similar groups of bonds.
Put simply; it can be a way to read what the bond market is thinking about the current economic climate on a graph. In other words, it is a snapshot of what bond markets think about the economic environment. It also tells us what may be about to happen next.
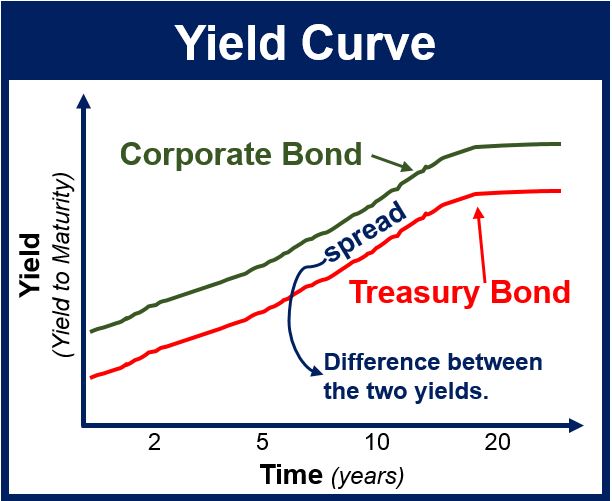 As the yield curves show, people expect a higher interest rate the longer they tie up their money. Corporate bonds tend to give a higher yield than government bonds.
An example would be measuring the dollar interest rates paid on U.S. Treasury securities with a variety of different maturity dates.
The Financial Times’ glossary of terms, ft.com/lexicon, has the following definition of the term:
“A graphical representation of the relationship between the yields and maturities of different bonds of similar quality, currency denomination, and risk (usually government bonds).”
Yield curve – a benchmark
We often use it as a benchmark for other debt in the market, including bank lending rates. It is also a benchmark for mortgage rates.
The most common yield curve observes the three-month, one-year, two-year, and five-year U.S. Treasury debt.
The yield curve measures the difference between short-term and long-term interest rates. Short-term rates are normally lower than the long-term ones.
The shape of the yield curve says a lot about future interest rate change. The three main shapes are: normal, inverted and flat.
A normal yield curve – long-term maturity bonds have a higher yield than short-term bonds.
An inverted yield curve – short-term yields are higher than the long-term yields. This may point, for example, to a recession.
A flat yield curve – the short-term and long-term yields are almost the same.
The shape of a yield curve indicates future interest rates. This can subsequently determine whether an economy will either expand or contract. The curves can provide economists with a lot of information about the current and potential future outcome of an economy.
Professor Campbell Harvey, at Duke University, demonstrated that inverted yield curves have occurred just before the last five U.S. recessions.
Financial institutions, major business newspapers (such as The Wall Street Journal), and the Federal Reserve typically publish yield curves.