Global carbon dioxide emissions growth has tailed off, after increasing rapidly for several years, says the European Commission Joint Research Centre (JRC). Global carbon dioxide (CO2) emissions grew by 0.8% in 2012, 1.5% in 2013, and 0.5% in 2014, after growing by an average of 4% annually for ten years.
In 2014, the global economy expanded by 3%, while emissions growth was nearly at a standstill.
The trend since 2012 thus sends an encouraging signal on the separation of CO2 emissions from global economic growth. However, the JRC stresses that it is still too early to be sure that a positive global trend is here to stay.
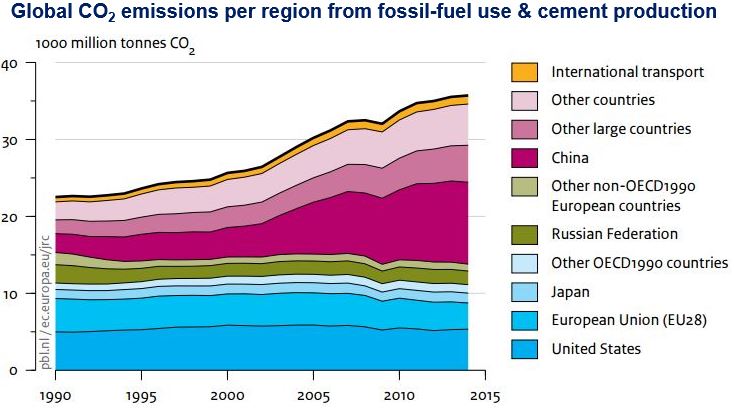 Image: European Commission Joint Research Centre
In India, for example, which is an emerging economy with a very large population, emissions grew by 7.8% in 2014, bringing the country into fourth place in the global emissions league table.
Europe continues to show leadership in reducing CO2 emissions
While the European Union’s GDP (gross domestic product) expanded by 1.4% in 2014, its CO2 emissions fell by -5.4% compared to 2013.
This followed two successive years of reductions: -0.4% in 2012 and -1.4% in 2013.
Total CO2 emissions in the European Union (EU) are 23% lower than they were in 1990.
The JRC’s study suggests three main reasons for this reduction:
1. A reduction of -4.5% in emissions from power plants and industrial facilities that are part of the EU Emissions Trading System.
2. A relatively mild winter which resulted in a ten percent reduction in demand for heating.
3. A reduction of -0.5% in oil consumption for transport.
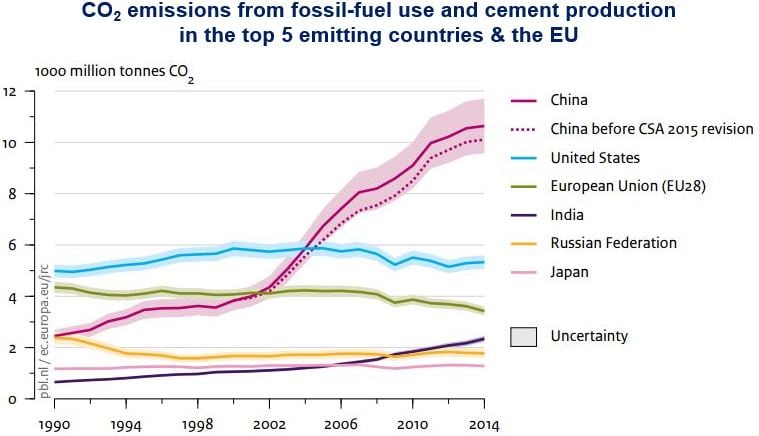 Image: European Commission Joint Research Centre
The following nations recorded significant reductions in CO2 emissions in 2014:
– Slovakia -10.6%
– The United Kingdom -9.0%
– Denmark -8.8%
– France -8.4%
– Italy -7.7%
– Finland -6.9%
– Greece -6.3%
– Austria -6.0%
– Germany -5.6%
– The Netherlands -5.3%
– Portugal -3.6%
– Poland -3.4%
Only Bulgaria and Cyprus increased their CO2 emissions – +6.9% and +0.5% respectively – of all the 28 EU Member States.
For the first time since records began, the EU’s share of global CO2 emissions is now below 10%. China is today responsible for 30% of global emissions, followed by the United States with 15%, and the EU with 9.6%.
Other country’s emissions in 2014
In Japan, CO2 emissions declined by -2.6%, Australia by -2.1% and Russia by -2.1%.
Globally, CO2 emissions increased by just 0.5% compared to the previous year. Fossil fuel combustion and industrial processes reached 35.7 billion tonnes of CO2 in 2014, compared to 35.3 billion tones in the previous year.
China’s emissions growth also slowed down
China, the world’s largest emitter, also managed to slow down. In 2014, CO2 emissions grew by just 0.9%, the same rate as the US.
Structural changes in China’s economy have played a major part in reducing global emissions.
USA has very high per capita emissions
Emissions per head of the population are extremely high in the United States, at 16.5 tonnes CO2 per capita in 2014, compared to 7.5 tonnes in China, and 7.1 tonnes in the EU.
These figures were published in a report by PBL Netherlands Environmental Assessment Agency and the European Commission’s Joint Research Centre.
Citation: “Trends in Global CO2 Emissions – 2015 Report,” PBL Netherlands Environmental Assessment Agency & European Commission Joint Research Centre. Authors: Jos G.J. Olivier (PBL), Greet Janssens-Maenhout (IES-JRC),
Marilena Muntean (IES-JRC), Jeroen A.H.W. Peters (PBL). November 2015.