Hang Seng Index – definition and meaning
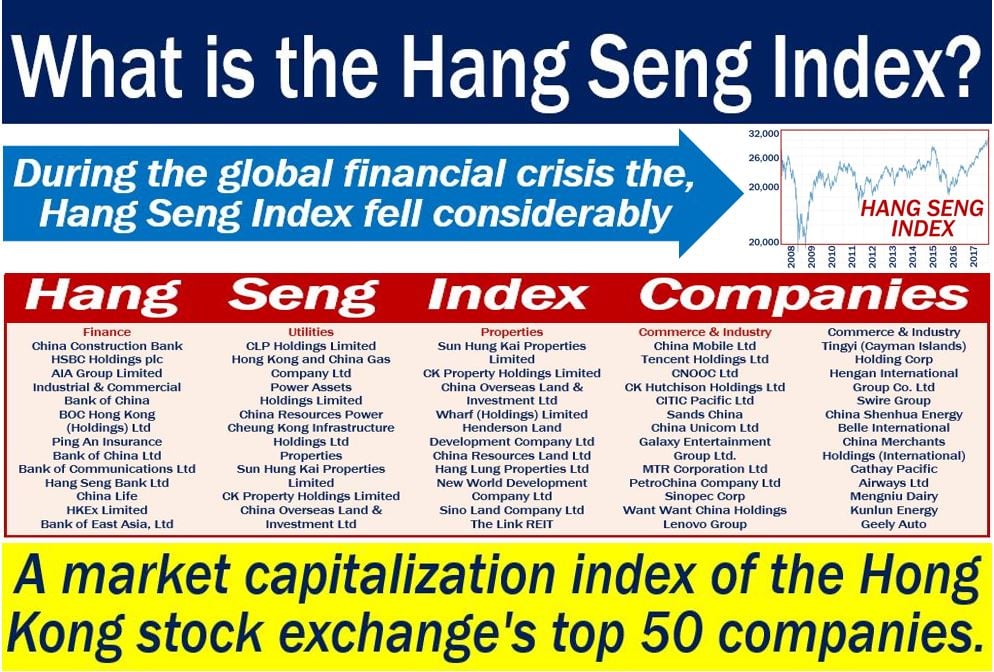
The Hang Seng Index or HSI is the barometer of the Hong Kong stock market. It is the market capitalization index of Hong Kong’s top fifty companies, i.e. those that appear on the Hong Kong stock exchange.
The Hang Seng Bank administers the Hang Seng Index. In fact, Hang Seng Bank owns the Hang Seng Indexes Company (Hang Seng Indexes). The Hang Seng Indexes manages a family of indexes, including the Hang Seng Index.
Hang Seng Bank is the leading index compiler covering not only Hong Kong’s market, but also those of mainland China.
The HSI is one of Hong Kong’s earliest stock market indexes. Operating since 1969, it is today the leading indicator of the performance of the Hong Kong stock market.
Hang Seng Index – sub –indexes
The Hang Seng Indexes Company Limited groups its HSI constituent securities into the following sub-indexes:
- Commerce and Industry
- Properties
- Utilities
- Finance
Hang Seng Index – history
Chairman of Hang Seng Bank, Ho Sin Hang, first conceived the idea of creating a ‘Dow Jones Index’ like service in Hong Kong.
Hang and Lee Quo-wei, Hang Seng’s Director, commissioned Stanley Kwan, Hang Seng’s research head, to create the index. It debuted on 24th November 1969.
The HSI’s base of 100 points initially equaled the stocks’ total value as of the market close on 31 July 1964.
It fell to 58.61 on 31 August 1967; an all-time low. However, it hit its record low before the publication of HSI.
In November 1993, the HSI passed the 10,000 point milestone for the first time. It then passed the 20,000 and 30,000 milestone points in 2006 and 2007 respectively. On 30 October 2007, the Hang Seng Index reached an all-time high of 31,958.41 points.
When the global financial crisis hit, however, the HSI declined significantly for over a year. From 30 October 2007 to 9 March 2008, the HSI lost 9,426 points, i.e., 30% of its value.
By 8 October 2008, the index had fallen to 15,431 points, i.e., more than 50% lower than its all-time high. On 27 October 2008, it fell to 10,676 points, or two-thirds lower than its all-time peak.
By 24 July 2009, it had recovered to 20,000 points and then reached 25,000 on 19 August 2014. Since then, the HSI has gone through significant bear and bull markets.
When share prices are declining, it is a bear market or a bearish trend. Conversely, when they are rising, we call it a bull market or a bullish trend.
Video – The Hang Seng Index
This Investor Trading Academy explains what the Hang Seng Index is.