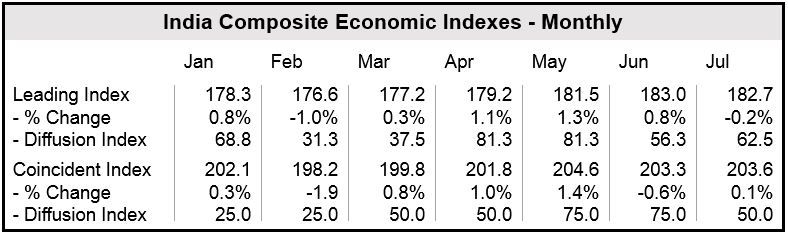
The Indian economic outlook, i.e. its Leading Economic Index, was slightly down (-0.2%) in July, after improving during the previous four months, says The Conference Board. Steep falls in industrial production of capital goods and services business activity were greater than the positive contributions made by stock prices, merchandise exports and bank credit to the commercial sector.
India’s Coincident Economic Index, however, was marginally improved (+0.1%) in July.
The Leading Economic Index (LEI) is a forecast on future economic activity; an increasing number suggests the economy will expand.
The Coincident Economic Index (CEI) looks at the current economic situation. Analysts, investors and economists use the CEI to determine at what stage of the economic cycle a country is in.
India’s Leading Economic Index (LEI):
Of the eight components that make up the LEI, four contributed positively in July.
Below is a list of the eight LEI components and how they contributed, in order of size of contribution (first is the largest positive contributor, last is the largest negative contributor):
- Merchandise exports (positive),
- Stock price index SENSEX: average (positive),
- M3: bank credit to commercial sector (positive),
- Cargo handled (positive),
- PMI: services business activity (negative),
- Industrial production: capital goods (negative),
- REER (real effective exchange rate): 36 currencies (negative),
- Interest rate spread (10yr – 91day) (negative).
After July’s 0.2% decline, the LEI for India currently stands at 182.7 (2004 = 100), after increasing by 1.3% and 0.8% in May and June respectively.
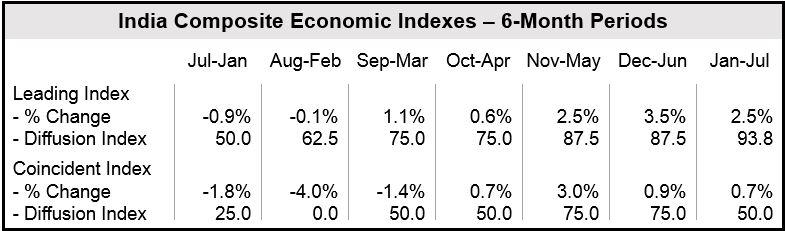
Over a six-month period ending on July 31, India’s LEI rose by 2.5%, with seven of the eight components contributing positively.
(Data source: The Conference Board)
India’s Component Economic Index (CEI)
Of the four components that make up India’s CEI, two contributed positively in July.
Below is a list of the four CEI components and how they contributed to July’s figure:
- Industrial production (positively),
- Total imports (positively),
- Car sales (negatively),
- Exports of agricultural products (negatively).
India’s CEI now stands at 203.6 (204 = 100) after July’s 0.1% increase. In May and June it increased by 1.4% and 0.6% respectively.
Over the six-month span through to the end of July, the CEI rose 0.7%, with two of the four components contributing positively.
(Data source: The Conference Board)
Challenges ahead
Despite India’s LEI falling slightly in July, Jing Sima, an Economist at The Conference Board, believes the country’s economic outlook for the second half of 2014 has improved. “A softer reading in the service sector PMI caused a small decline in the LEI in July. However, the exports and financial indicators remain strong,” he said.
Director for Business Cycles and Growth Research at The Conference Board, Ataman Ozyildirim, added:
“Broad-based strength among the leading indicators throughout the last six months point to improving economic conditions for India in the second half. However, July’s slight decline in the LEI highlights the challenges lying ahead where a moderation in services and manufacturing of investment goods offsets a brighter outlook from merchandise exports, stock prices, and bank credit to commercial sector.”
In June, 2014, India’s new Prime Minister, Narendra Modi, unveiled India’s economic reforms aimed at improving the nation’s electricity infrastructure, water supply, as well as an ambitious program of investments into high-speed trains and “smart cities”.