January existing home sales declined to their lowest level in 18 months, but prices rose as inventory shortages persisted in much of the country, says the National Association of Realtors.
Total existing home sales fell 5.1% in January 2014, to a seasonally adjusted annual rate of 4.62 million, compared to 4.87 million in December.
January 2014 was below January 2013’s total of 4.87 million.
The Existing Home Sales data measures prices and sales of existing single-family dwellings overall nationally, and provides breakdowns for the Northeast, South, West and Midwest regions.
The figures include single family homes, co-ops and condos.
January’s activity level was the lowest since July 2012’s total of 4.59 million.
(Source: National Association of Realtors)
January existing home sales affected by bad weather and…
Chief economist at the National Association of Realtors, Lawrence Yun, said abnormally severe weather is playing a role:
“Disruptive and prolonged winter weather patterns across the country are impacting a wide range of economic activity, and housing is no exception.”
“Some housing activity will be delayed until spring. At the same time, we can’t ignore the ongoing headwinds of tight credit, limited inventory, higher prices and higher mortgage interest rates. These issues will hinder home sales activity until the positive factors of job growth and new supply from higher housing starts begin to make an impact.”
The median price for existing homes in January, 2014 (all housing types) was $188,900, an increase of 10.7% compared to January 2013. Distressed homes – short sales and foreclosures – represented 15% of January sales, versus 14% in December and 24% in January last year.
Foreclosures accounted for 11% of January sales, and short sales 4%. Foreclosures were sold by a discount of (average) 16% of market value in January, and short sales 13% below.
January saw a 2.2% increase in total housing inventory to 1.9 million existing homes for sale, representing a 4.9-month supply at the current pace of sales, an increase from December’s 4.6 months.
Levels of unsold inventory in January were 7.3% higher than in January 2013’s 4.4-month supply. Realtors consider a supply of 6 to 6.5 months as a rough balance between sellers and buyers.
Freddie Mac says the national average commitment rate for a 30-year, conventional fixed-rate mortgage declined to 4.43% in January 2014, compared to 4.46% the month before; in January 2013 the rate was 3.41%.
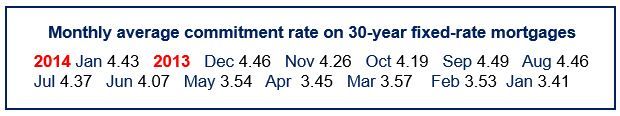
(Source: Freddie Mac)
Higher flood insurance costs affecting market
Steve Brown, President of the National Association of Realtors, said that apart from abnormally severe weather conditions, higher flood insurance premiums have affected the market in areas regarded as flood zones, which account for approximately 8% to 9% of sales.
Brown said:
“Thirty percent of transactions in flood zones were cancelled or delayed in January as a result of sharply higher flood insurance rates.”
“Since going into effect on October 1, 2013, about 40,000 home sales were either delayed or canceled because of increases and confusion over significantly higher flood insurance rates. The volume could accelerate as the market picks up this spring.”
Congress is currently considering legislation to block new flood insurance rates so that FEMA (Federal Emergency Management Agency) can complete an affordability study and determine the law’s full impact.
The average time all homes were on the market was 67 days in January, compared to 72 days in December. In January, short sales were on the market for 150 days (average), foreclosures 58 days, and non-distressed homes 66 days. Nearly one third of all homes (31%) were on the market for less than one month.
Twenty-six percent of all purchases in January consisted of first-time buyers, compared to 27% in December and 30% in January 2013.
January 2014 registered the lowest percentage for first-time buyers since October 2008, when the National Association of Realtors started monthly measurements. Typically, first-time buyers represent about 40% of all purchases.
Thirty-three percent of all transactions were cash sales, compared to 32% in December and 28% in January 2013.
Twenty percent of all purchasers were individual investors in January, versus 21% in December and 19% in January 2013. Seventy percent of all investors in January paid in cash.
Single-family homes
Sales declined 5.8% in January to a seasonally adjusted annual rate of 4.05 million, compared to December’s 4.3 million, six percent below January 2013’s 4.21 million-unit pace.
The median existing single-family home price increased to $188,900, a rise of 10.4% over a 12-month period.
Existing condominium and co-op sales
Sales remained unchanged in January at an annual rate of 570,000 units, 1.8% higher than in January 2013. The average existing condo price in January was $188,700, thirteen percent higher than in January 2013.
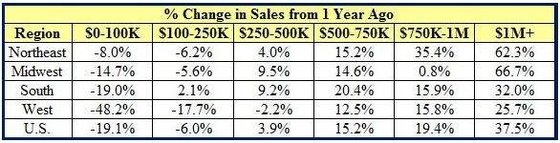
January existing home sales by region:
(Source: National Association of Realtors)
The Northeast – sales fell by 3.1% to an annual rate of 620,000, lower than January 2013 by 3.1%. The median price rose 6.6% to $241,000.
The Midwest – sales declined by 7.1% to a 1.04 million pace, 8.8% lower than in January 2013. The median price rose by 7.6% in twelve months to $140,300.
The South – sales fell by 3.5% to an annual level of 1.95 million, which was 1.6% higher than in January 2013. The median price increased by 9.4% to $161,500 over a twelve-month period.
The West – sales declined by 7.3% to a pace of 1.01 million, 13.7% higher than in January 2013. The median price rose more steeply by 14.6% over twelve months to $273,500.
Home value growth of all types of houses slowed down to 0.2% in January, the smallest monthly increase since May 2012.