Property prices across the UK rose 8.2% in the year to April, with the average price rising to £209,054, up £16,000 from last year and a £1,300 increase on March, according to the new UK House Price Index.
The average property price in London surged by 14.5% to £470,025 in the year to April and 0.6% over the month. The City of London experienced a 27.3% surge over the past year, boosting the average property value there to £928,217.
The average property price in the South East and the East of England stand at £302,000 and £263,000 respectively.
Annual price change for UK by country over the past five years:
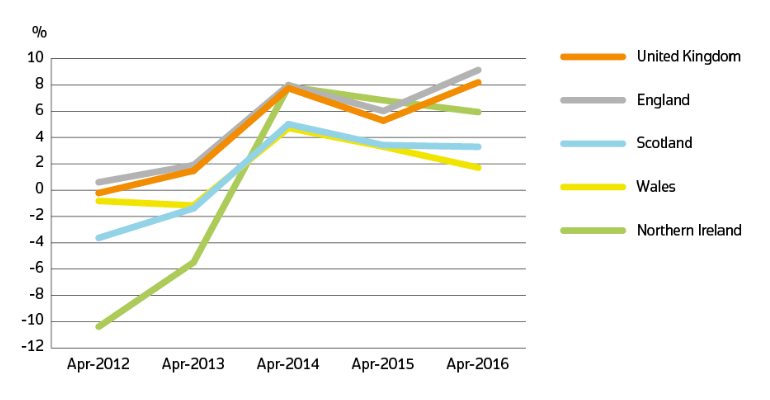
Property price increases by country
House prices in England rose by 9.1% over the year to April, with the average property now costing circa £225,000.
In Wales property prices rose by 1.7% over the past year, increasing the average property value to £139,385.
House prices in Scotland rose by 3.3% in the year period, reaching £138,445.
Slowest growth in the North East of England, Wales, and the South West
The slowest annual property price growth was in the North East of England, where prices only increased by 0.1% – the average property price in the area only stands at £121,719.
Between April and March house prices slipped 0.9% in the North East, dropped by 1.9% in Wales, and dropped 2.8% in the South West.
Most expensive place to live is in London, cheapest place to live is in Lancashire
The most expensive places to buy properties in the UK are in the London boroughs of Kensington and Chelsea, where the average home costs £1.3 million, according to the new index.
In contrast, the cheapest place to buy a property is in Burnley in Lancashire, where the average house only costs £73,000.
Lending approvals for homes dropped in April to lowest level in almost a year as did home sales
Following six months of consecutive increases, the volume of lending approvals for house purchases fell by 5.8% in April 2016 compared to the previous month, to its lowest level since May 2015.
The number of UK home sales did increase in the three months to April 2016 (February to April): up 8.3% compared to the previous three months, however sales fell by 45.2% in April 2016 compared with March 2016.
Number of sales by country
| Country | February 2016 | February 2015 | Difference |
|---|---|---|---|
| England | 56,884 | 56,261 | 1.1% |
| Northern Ireland (Quarter 1 – 2016) | 5,272 | 4,555 | 15.7% |
| Scotland | 5,507 | 5,113 | 7.7% |
| Wales | 2,796 | 2,686 | 4.1% |
Average monthly price by property type
| Property type | April 2016 | April 2015 | Difference |
|---|---|---|---|
| Detached | £310,364 | £290,900 | 6.7% |
| Semi-detached | £197,168 | £181,200 | 8.8% |
| Terraced | £171,298 | £157,103 | 9.0% |
| Flat or maisonette | £187,793 | £173,968 | 8.0% |
| All | £209,054 | £193,225 | 8.2% |