The US August Leading Economic Index increased by just 0.2% to 103.8 compared to 0.7% and 1.1% rises in June and July respectively, according to data published by The Conference Board on Friday. August’s Leading Economic Index (LEI) now stands at 103.8 (2004=100).
The Conference board publishes two gauges for national economies globally – the LEI (Leading Economic Index) and CEI (Coincident Economic Index). The LEI predicts likely economic activity during the next six months, i.e. it gives economists an idea of a nation’s short-term outlook. The CEI shows how the economy is at the moment. Analysts study the CEI to determine where a country’s economy is within the economic cycle.
Ataman Ozyildirim, an economist who works at The Conference Board, said that although US economic indicators for August were less encouraging than in June or July, it was still an increase.
Mr. Ozyildirim said:
“The LEI’s six-month growth trend has been held back slightly by lackluster contributions from housing permits and new orders for nondefense capital orders. Despite concerns about investment picking up, the economy should continue expanding at a moderate pace for the remainder of the year.”
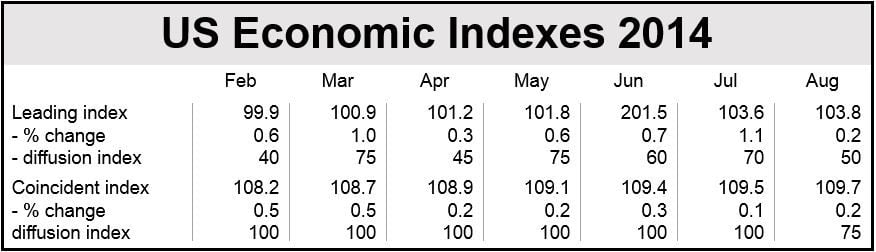
(Data source: The Conference Board)
Economist Ken Goldstein, who also works at The Conference Board, says the US economy will not grow at the spectacular rate seen during the second quarter.
Mr. Goldstein added:
“Meanwhile, the CEI, a measure of current economic activity, continued to expand through August, amid improving personal income, employment and retail sales. However, industrial production registered a slight decrease for the first time in seven months.”
The Conference Board says that taken together – both the LEI and CEI – the US economy’s recent GDP (gross domestic product) growth trend should continue, but at a more moderate pace in the near term.
United States Leading Economic Index (LEI)
Of the ten components that make up the LEI, three contributed positively in August.
Below is a list of the ten LEI components and how they contributed to August’s figure:
- Leading Credit Index (positive),
- Interest rate spread, 10-year Treasury bonds less federal funds (positive),
- ISM new orders index (positive),
- Average weekly hours, manufacturing (no change),
- Manufacturers’ new orders, consumer goods & materials (no change),
- Average consumer expectations for business conditions (no change),
- Manufacturers’ new orders, non-defense capital goods excl. aircraft (negative),
- Average weekly initial claims for unemployment insurance (negative),
- Building permits, new private housing units (negative),
- Stock prices, 500 common stocks (negative).
The US LEI currently stands at 103.8 (baseline 2004=100). Over the six-month period ending in August, the LEI increased by 3.9%, with 8 of the 10 components contributing positively.
United States Coincident Economic Index (CEI)
Of the four components that make up the CEI, three contributed positively to August’s result.
Below is a list of the four CEI indicators and how they contributed in August:
- Personal income less transfer payments (positive),
- Employees on non-agricultural payrolls (positive),
- Manufacturing and trade sales (positive),
- Industrial production (negative),
The US CEI currently stands at 108.7 (2004 baseline is 100). During the six-month period ending in August, the CEI rose by 1.4%, with all four components contributing positively.