 Allocation of responsibilities, careful planning, and scheduling of tasks are important for the successful completion of any project. As many people are involved in the completion of multiple projects, every project manager needs to be able to chart the progress of different tasks being undertaken at different points in time. This is made possible and easier by using a Gantt chart.
What is a Gantt chart?
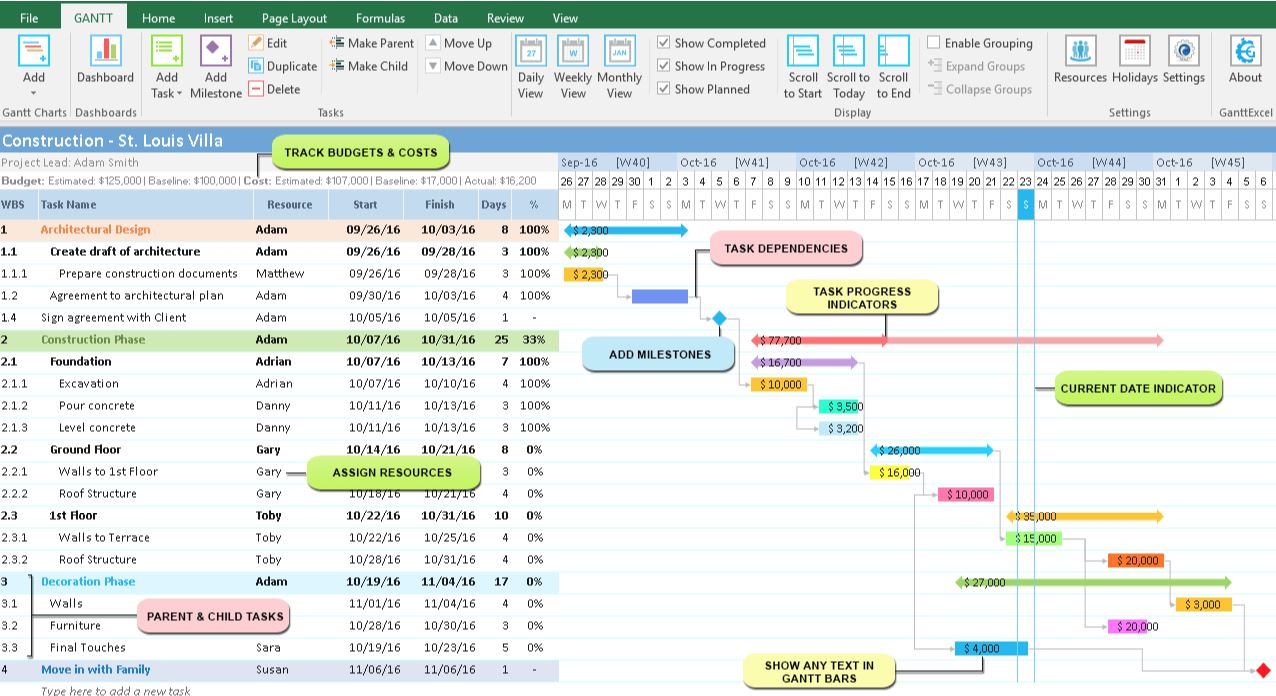
A Gantt chart is a horizontal bar chart that visually represents different activities of a particular project at different time intervals. Gantt charts are very helpful in project management as one can comprehend who is doing what and when, at a glance.
Project management refers to planning, organizing, and managing everything related to a project to make sure it is completed on time, within budget, and properly.
A Gantt chart uses the X and Y axis. The vertical axis denotes the various tasks that are generally part of a project. The horizontal axis shows the time durations for the completion of each activity.
Where is it used?
Gantt charts are useful in almost every industry as they give a live picture of the work that your colleagues or employees are doing on any given day. Gantt charts are an important tool for industries like software, construction, marketing, human resources, consultancy, event management and many others.
What information does a Gantt chart provide?
Timely completion of assignments is the key to having happy clients and receiving more work. Whether it is a small project or a vast endeavour, everybody involved must be aware of the time that they have to finish their tasks and also the work that needs to be done before or after the completion of one particular task.
Gantt charts specify the start and end time of every activity. Apart from this, project managers use Gantt charts to get a bird’s eye view of multiple activities happening simultaneously; so that they can ensure that every project is on schedule and also prepare for any delays or problems that may be noticed.
Gantt charts demonstrate information like the date of commencement of a project; tasks included in the project, who is responsible for them, how long the tasks will take, time duration of each, inter-dependence of tasks and the end date of the project.
How did it originate?
In 1896, Karol Adamiecki created the first project management chart- the Harmonogram; which was a precursor to the contemporary Gantt chart. He published it in 1931 but as it was only in Polish, it received limited recognition and adoption.
The Gantt chart used today was developed sometime around 1915 by an American engineer and project management consultant named Henry Gantt; after whom the chart is named. This became popular as a progress tracking tool used by project managers, team leaders, CEOs, operation managers or scheduling managers.
Today, Gantt charts are used by teams as well, rather than one single person in charge of a group. Construction teams, product development teams, marketing teams, telecommunication teams, engineering teams and many others utilize Gantt charts in order to collaborate easily and track the work being done.
Benefits of using Gantt charts
1. Visual representation of your project
Gantt charts allow people to see the entire project unfurled in front of their eyes. Thus one can easily give instant updates about project status to superiors or shareholders. Viewing the entire project makes it easier to spot any anomalies or issues that may arise and delay the timeline.
2. Checks the inter-dependence of tasks
The various tasks in any project are all interlinked and often cannot be undertaken unless the predecessor is completed. Gantt charts provide a visual recognition of which activity needs to be completed after which one and what follows.
3. Facilitates communication
Constantly communicating with all team workers in person is time consuming and sometimes, not feasible due to time, distance or budget constraints But if a project manager shares an updated Gantt chart with all employees, workers can easily take a look at who is doing what and when. This ensures that everyone knows their job and can do it on time, saving you any delays and extra costs.
4. Facilitates allocation of tasks
It is difficult for project managers to keep track of all the responsibilities and their timelines, given to any particular employee. But a Gantt chart helps see which employees are free and when, to take up more work; so that nobody gets overburdened and nobody sits idle either.
5. Digitally available
Gantt charts were once laboriously prepared on paper and any changes in the data would require a newly made, updated Gantt chart. Now with technological advancement, Gantt charts are editable and shareable, making them instantly available and easy to edit at any point. People now do not need any special training or qualifications to prepare Gantt charts. The Gantt chart software can be of help.
Gantt charts aid companies in saving resources, and saving resources is equivalent to saving more money, ensuring profits.