Business Management Dashboards help businesses to get an overview of their performance. They give managers a big picture view of what is going on so that they can make informed decisions and take action quickly.
The first step in designing a dashboard is to understand your audience and their information needs. This is crucial to create the most useful visual of the business activity.
Data Analytics
Regardless of your industry or business, it’s important to know how to use Data Analytics effectively. The process involves gathering, importing, analyzing, and reporting data in order to make informed decisions about your business.
Before you start using Data Analytics, determine who will be able to benefit from the information and how many dashboards you need. This will help you create the right dashboard with main 5-7 KPIs for each of the dashboard owners.
The next step is to organize your data, and this can be done by Power BI analytical software. This will help ensure you’re not missing any information and that your data is accurately reflected in business management dashboards.
Using Data Analytics is vital in today’s world, where the amount of information available to us has never been so high. A streamlined, well-organized system will save you time and make it easier for you to make decisions that are best for your company.
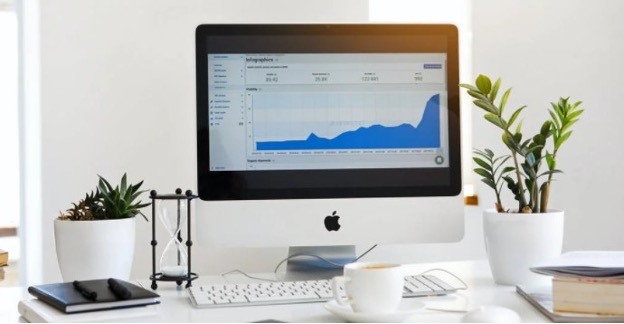
Business Dashboards
Business Management Dashboards help business managers track relevant data points and key performance indicators (KPIs) in one convenient location. This helps them stay on top of business metrics and make informed decisions, which improve business performance.
Business dashboards can be used by executives and workers in finance, sales, customer service, human resources and other departments to monitor business performance and do financial planning and analysis. They typically include financial KPIs such as revenue, operating expenses, profits and cash holdings.
When developing business dashboards, it’s important to understand your audience and which metrics they want to see. This helps you tailor your visualizations to meet their needs.
Your dashboard should also provide context for the metrics you’re tracking, so business leaders can see how they’re progressing toward their strategic goals. They’ll be able to see how their efforts are tracking against established benchmarks or strategic objectives and take action when needed.
Business Intelligence
BI dashboards consolidate data, present insights and provide a unified view of business metrics. They allow you to track key performance indicators (KPIs) in a simple and efficient way.
There are many types of BI dashboards, with the most common being tactical, analytical and operational. Each type serves a different purpose and has its own set of use cases.
Tactical BI dashboards are used to keep an eye on specific, time-sensitive business operations. They are usually handled by junior management and are based on real-time data.
Analytical BI dashboards are often more complex and used by line management to support root cause analysis and to discover insight. They include more contextual data, comparative analysis and historical trends than other types of BI dashboards.
Effective data visualization allows for more informed decision-making and enables businesses to identify trends related to business activities and improve the efficiency of their operations. It also enhances communication within a company and among the various departments.
Interactive Reporting Development Services
Business management dashboards are designed to be customized and easily accessed by all users within a business. They display data on a variety of metrics for use by executives and staff to help them make decisions that are most likely to work.
Typically, these reports are available in real-time to reduce the time spent crunching numbers and leave more time for analysis. They also enable users to filter & slice and dice the data so they can quickly identify trends and areas for improvement.
Some dashboard solutions offer pre-built, department-specific scorecards and reports to simplify the process of obtaining the data that business users need. These are often built into popular CRM and HR suites or can be integrated into other applications.
These are easy to order from professional BI developing companies, and they can be developed further after the whole analytical system is implemented. This helps save the IT department’s resources as the number of requests for database queries and customizations goes down.
You may be interested in: What is business intelligence? Importance of business intelligence