
If you’re an avid trader or investor, you’re probably always looking for an edge in the market. One popular tool that traders use to identify potential buy and sell signals is the stochastic oscillator. In this article, we’ll dive into the best stochastic settings for a 15-minute chart and discuss how you can use this tool to gain potentially higher profits in the financial markets.
What is the Stochastic Oscillator?
The stochastic oscillator is a technical analysis tool that measures the momentum of a stock or other asset. It was developed in the late 1950s by George Lane and is based on the idea that closing prices tend to be at the high end of their trading range during an uptrend and at the low end of their range during a downtrend.
The stochastic oscillator consists of two lines: %K and %D. %K is the faster of the two lines and is usually displayed as a solid line, while %D is the slower line and is often shown as a dotted line. The oscillator is scaled from 0 to 100 and is usually plotted below the price chart of the asset being analyzed.
Best Stochastic Settings for a 15-Minute Chart
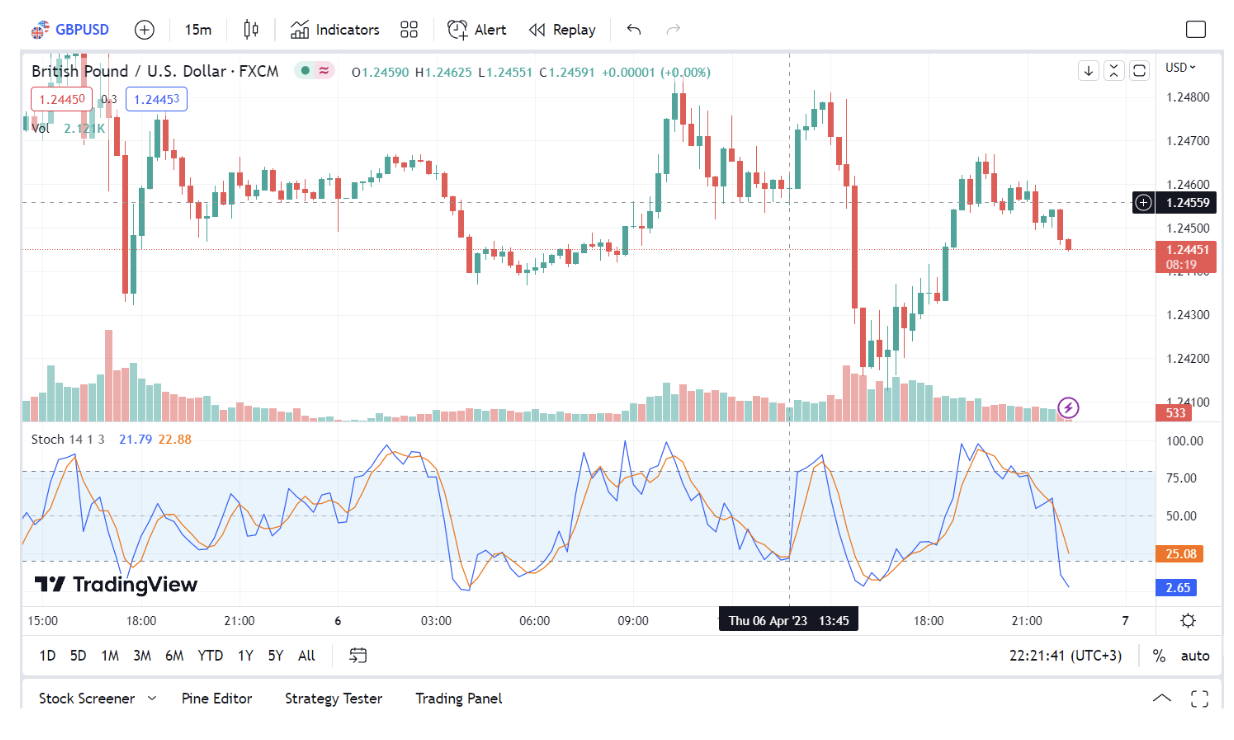
When determining the best stochastic settings for 15 minute chart, it’s important to consider the specific characteristics of this timeframe. The 15-minute chart is a popular timeframe for short-term traders who are looking to capitalize on intra-day price movements.
The default stochastic settings of 14,3,3 may not be the most appropriate for this timeframe because they may not provide a sensitive enough reading of the momentum of the asset being analyzed. After extensive research and backtesting, it has been found that the best stochastic settings for a 15-minute chart are 5,3,3. They provide a more sensitive and accurate reading of the momentum of the asset being analyzed, which can lead to better trading decisions.
However, it’s important to note that there is no one-size-fits-all solution when it comes to determining the best stochastic settings for a specific timeframe. Traders should always backtest different settings and use their own judgment to determine the settings that work best for their trading style and strategy. In addition, it’s important to consider other factors when using the stochastic oscillator, such as the overall trend of the market, key support and resistance levels, and news events that may impact the asset being analyzed.
How to Use the Stochastic Oscillator on a 15-Minute Chart
Now that we know the best stochastic settings for a 15-minute chart, let’s discuss how to use this tool to identify potential buy and sell signals.
Identify Overbought and Oversold Conditions
The stochastic oscillator is used to identify overbought and oversold conditions in an asset. When the oscillator is above 80, the asset is considered overbought, and when it’s below 20, the asset is oversold. This means that the asset may be due for a reversal in trend.
Look for Divergences
Another way to use the stochastic oscillator is to look for divergences between the oscillator and the price of the asset. A bullish divergence occurs when the price of the asset is making lower lows, but the oscillator is making higher lows. This indicates that the momentum of the asset is starting to shift to the upside.
On the other hand, a bearish divergence occurs when the price of the asset is making higher highs, but the oscillator is making lower highs. This indicates that the momentum of the asset is starting to shift to the downside.
Wait for a Signal
Once you’ve identified an overbought or oversold condition or a divergence, you’ll need to wait for a signal to enter or exit a position. One common signal is when the %K line crosses above or below the %D line. When the %K line crosses above the %D line, it’s a buy signal, and when it crosses below, it’s a sell signal.
It’s important to note that the stochastic oscillator is a lagging indicator, which means that it may not provide the most accurate signals in fast-moving markets. Therefore, it’s essential to use other tools and indicators in conjunction with the stochastic oscillator to confirm potential buy and sell signals.
Conclusion
Setting the appropriate stochastic settings is crucial when using the stochastic oscillator as a tool for trading on a 15-minute chart. The default settings of 14,3,3 may not provide the most accurate readings for this timeframe, which is why we have found that the best stochastic settings for a 15-minute chart are 5,3,3.
If you are from India and looking to use Stochastic settings, you need to have an India specific Demat Trading account to get started. DigitalFinanceClub has a great list of tools and services that are required for traders.
By using the correct settings, traders can get a more sensitive and accurate reading of the momentum of an asset, which can lead to better and more profitable trading decisions. However, it’s important to remember that the stochastic oscillator is just one tool in a trader’s arsenal and should be used in conjunction with other technical analysis tools and indicators. Successful trading requires a combination of technical analysis, fundamental analysis, market knowledge, and risk management. By considering all of these factors and using the stochastic oscillator with the best settings for a 15-minute chart, traders can increase their chances of dominating the market and achieving their trading goals.