A Fibonacci sequence is a group of numbers that are used in several different trading strategies. The sequence of numbers was discovered by an Italian Mathematician Leonardo Pisano Bogollo. The Fibonacci sequence has some unique features. After the first two numbers, each number in the sequence is the sum of the prior two numbers. The sequence extends to infinity, starting at zero, and 1,2,3,5,8,13,21,…
The number in the Fibonacci sequence also forms the golden ratio. These are numbers used in trading strategies to determine where an index, currency, commodity, or stock will target. The ratios are calculated by dividing a number by the previous number which approximately equals 1.618 (8/5=1.6,21/13=1.61, 34/21=1.61, 55/34=1.61. The approximation nears 1.6180 as the numbers increase. Another ratio that is generated from the Fibonacci sequence is 0.38. Any number divided by another two places higher approximates .3820.
Fibonacci Retracements
The most common way to use Fibonacci ratios for a trading strategy is the Fibonacci Retracement. This calculation helps you determine where the price of a stock will retrace following a move higher or lower. You can use this to manage your risk or target a take profit or stop loss level. For example, after the price of a stock rises, it will likely retrace slightly declining to the 38% retracement level.
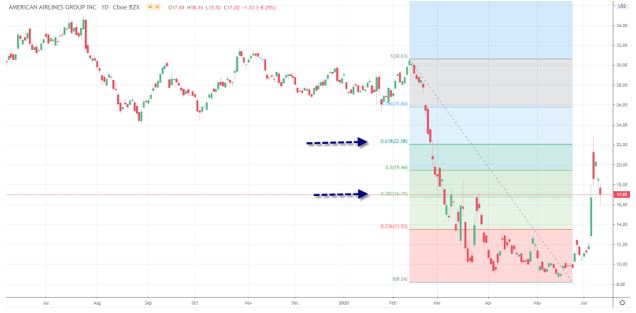
In the chart of American Airlines, you can see that in February and March of 2020, the price of the stock tumbled declining approximately 71% from its peak in February to its trough in April. After the price of the stock was able to stabilize, it started to rally and it rebounded back to the 38.2% retracement level. After a brief respite, the stock price began to rise again up to the 61.8% retracement level, where it found resistance and reversed.
You can calculate Fibonacci retracements on your own or use trading software that provides you with this information. To calculate the retracement on American Airlines you would find the high point that you want to calculate the retracement from the low point and subtract the trough from the peak ($31-$9).
You would then multiply the difference by $22 by 61.8% and 38.2%. The results are $22 * 61.8% = $13.0 and $8.0 respectively. You could then add these numbers to $9 which equals approximately $22 and $17 which are your 61.8% retracement level and your 38.2% retracement level.
If you are trying to calculate a retracement after a rally in the stock, you would subtract the Fibonacci retracement from the high to determine the target support levels for both the 38.2% level and the 61.8% level.
You could use these retracement levels to determine potential target points. In many situations, a financial-security will begin to consolidate around the Fibonacci retracement level, before it either reverses or continues to a higher level.
Fibonacci Arcs
There are several other tools that you can use which use the Fibonacci sequence and golden ratio to formulate support and resistance levels. Fibonacci Arcs are half circles and use the 38% and 61.8% arcs to find support and resistance levels. Fibonacci Fans use a similar concept. There are even studies like Fibonacci Time Zones, which use vertical lines based on the Fibonacci Sequence.
The Bottom Line
The upshot is that Fibonacci ratios are calculations that are used to formulate support and resistance levels that can help you trade. By using Fibonacci retracements and arcs you can calculate levels that where security is likely to consolidate before it begins to continue to move higher reverse. Most trading software provides these technical analysis tools in conjunction with trend lines.
Interesting related article: “The comobo of Technical, fundamental, and Fibonacci trading.”