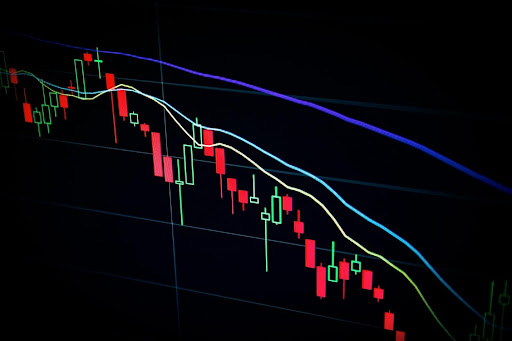
eToro is a popular online trading platform that allows users to engage in copy trading. Copy trading is a process that involves following the trades of experienced traders and copying their strategies. With eToro, you can use their charts to help you make informed decisions when it comes to copy trading. eToro’s charts are an important tool for anyone interested in copy trading. Copy trading is a process of copying the trades of experienced traders, allowing less experienced investors to make profitable investments without needing to understand complex financial strategies. eToro price charts allow investors to observe how other traders are investing, choose the best traders to copy, and monitor their own portfolios. In this article, we will discuss how eToro’s charts work, including what types of charts, are available and how they can help you in your copy trading endeavors.

What do the numbers mean on eToro?
eToro is a social trading and investment platform that has gained popularity over the years. With its user-friendly interface, it has become an excellent option for both novice and experienced traders. However, if you’re new to the platform, you may be wondering what the numbers mean on eToro.
Firstly, every asset on eToro comes with different numbers that can be confusing to understand at first glance. For instance, when you look at a stock’s page, you’ll see several figures such as “last,” “sell” and “buy.” The last price represents the most recent traded price of an asset on eToro, while sell and buy prices reflect how much buyers are willing to pay for an asset or how much sellers are willing to sell their assets for. Moreover, there’s also a concept called leverage on eToro.
Does eToro use Trading View?
eToro is a popular social trading platform that allows users to copy the trades of successful traders. It has become increasingly popular amongst beginner traders who are looking for a user-friendly platform to learn about financial markets and start trading. One question that many people have been asking is whether eToro uses TradingView, the charting and analysis tool used by many traders.
The answer is yes, eToro does use TradingView as part of its platform. The integration of TradingView provides users with access to powerful tools for technical analysis, including multiple chart types, indicators, and drawing tools. This makes it easier for users to analyze market trends and make informed decisions about their trades.
In addition to the technical analysis tools provided by TradingView, eToro also offers social trading features that allow users to follow and copy the trades of other successful traders on the platform.
What are eToro pro charts?
eToro is a popular social trading platform that has become increasingly popular among traders over the years. One of the features that make it stand out is the eToro Pro Charts, which provide advanced charting capabilities for technical analysis.
The eToro Pro Charts allows traders to access real-time charts that can be customized according to their preferences. It comes with various indicators such as RSI, MACD, and Bollinger Bands. You can also add trend lines and other drawing tools to enhance your technical analysis.
Moreover, the eToro Pro Charts come with a range of timeframes, from one-minute to monthly intervals, which makes it easy for traders to analyze market movements in different periods. It is an ideal tool for day traders and long-term investors alike who want to gain insights into market trends and make informed trading decisions.
Trading Profits with eToro Charts
If you’re looking to maximize your trading profits, eToro charts are an indispensable tool. These charts provide traders with a wealth of information that can help them make more informed decisions about when to buy and sell assets. In this article, we’ll take a closer look at some of the key features of eToro charts and how you can use them to boost your profitability.
One of the most powerful features of eToro charts is their ability to display historical price data for an asset. This allows traders to see how the price has changed over time, which can help them identify trends and patterns that may be useful in predicting future price movements. Additionally, eToro charts offer a variety of technical indicators that can be used to further refine these predictions.
Exploring charts on Toro Demo Trading
eToro is an online trading platform that provides a variety of financial instruments for users to trade. One of the most important features of this platform is its charts, which help traders analyze and make informed decisions about their investments. These charts are available for all types of instruments including cryptocurrencies, stocks, and commodities.
The charts on eToro are highly customizable, allowing users to adjust various aspects such as timeframes, indicators, and chart types. This enables traders to tailor their analysis according to their specific needs and preferences. Furthermore, these charts are updated in real time so that traders can stay up-to-date with market changes as they occur.
Conclusion Remarks
Understanding how to analyze and interpret a chart provided by eToro can help traders make informed decisions when trading on the platform. With this knowledge, traders can better identify trends, track changes in the market, and analyze various trading strategies. eToro’s charts provide an easy to use interface that offers a variety of features to suit different preferences. By taking advantage of these features, it is possible for traders to get an accurate view of their trades and investment performance.
