Most of the FX educational resources, classes, and courses teach beginners to follow the current trend. The task of predicting trend reversals is tough even for experienced traders as the likelihood and frequency of such events are low. That does not mean that strong trends happen much more often, as there are also periods of sideways consolidations or range-trading. But once a trader caught sustainable price action, it would be worth getting maximum results of it, wouldn’t it?
One of the basic rules in trading say that the markets always move like ways. If you missed a strong trend, you should not be worried about that. The market will always give you a chance to jump in and join the party.
Healthy retracements and rebounds are required for any continuous trends and those whipsaws have to be considered for fresh by-trend positions. The most popular example of such action is the ABC movements, where A is the first spike of the trend, B is the retracement back and C is the continuation in the same initial directions. It’s crucial for the trend continues that the depth of the B retracement does not have to exceed 50% of the A action.
The best-case scenario is when the correction stays in the range of 23.6/38.2% (Fibonacci Retracement Levels). That rebounds have to be watched closely because sometimes even one pip can decide the fate of the trend. Traders spend dozens of hours calculating those technical levels in order to identify the best entry price and pull the trigger in time. The main question is how to find those support/resistance levels?
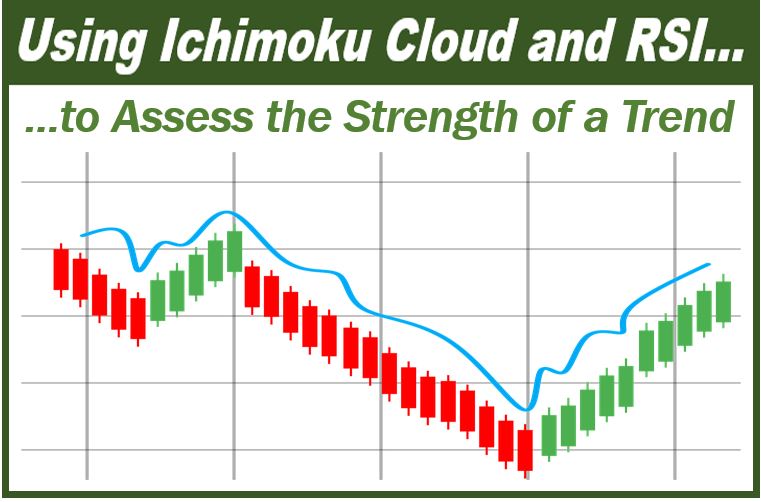
How to Use Combination: Ichimoku Cloud and RSI?
We need to find a combination of technical indicators which would show us rebound depth and the trend momentum at the same time.
The Ichimoku Cloud system is designed to keep traders on the right side of the market.
Ichimoku trading Strategy is based on combination of technical tools:
First – Ichimoku Cloud indicator
This is one of the most powerful trend indicators with multi-task purpose and use. Of course, it’s a bit complicated as it has five different parameters and formulas to be calculated. But the graphical view is quite simple to understand. It has a span which indicates whether an asset is in the up- or down-trend. And it has three lines, pointing to the price direction.
Two of those lines work as support levels in the uptrend (when the price is above both lines and the span at the same time) and as resistance levels in the downtrend (the opposite configuration of prices, lines and the cloud).
We prefer using default settings of the Ichimoku Cloud indicator. However, the parameters can be changed depending on any particular timing strategy and money management rules. But it’s not recommended to decrease the default parameters. The practice shows that widening indicator’s period gives a fewer number of fake signals.
Traders can test the trading algorithm changing Ichimoku’s parameters to closest figures in the Fibonacci row. For example, 13 instead of 9 for Conversion Line period, 34 instead of 26 for Base Line period and 55 instead of 52 for the Lagging Span period.
Second – Strength Index Oscillator
technical indicator of this trading system is the Relative Strength Index Oscillator. That’s an additional tool just to secure traders from misleading information in case of fake brekouts and whipsaws. The default period of the oscialltor has to be changed as well. We prefer the period of 21 instead of 14 but traders could also experiment with value of 13 bars as an option.
The main function of the RSI here is to confirm the current trend momentum. As long as we’re going long on a falling price and short on growing price, we must assess wether this action is a retracement of the main trend or is that a complete reversal. So, the RSI value has to remain above the 50% level for an uptrend (close prices matter but not high/low prices) and below the 50% for the downtrend.
The sequence of actions for long positions has to be the following. The price spikes up, appearing above Ichimoku cloud and both Conversion Line and Base Line. Then it reverses and starts a retracement down. We open long positions when prices test Ichimoku Conversion Line from upside, while the RSI value stays above the 50% level.
We could repeat the action on a test of Ichimoku Base Line with the condition that the RSI is still in the positive territory. Stop-loss orders have to be hidden below the Base Line for the first position and below the upper range of the Ichimoku Span for the second long position. Take-profit orders are trailing but the bullish continuation suggests at least a re-test of the previous top if not a new high price charted. It’s better taking profits manually when the RSI will appear in extremely overbought territory, or chart a bearish divergence, signalling that the bullish momentum is exhausted.
For short positions, we have to find strong downtrend when the price appears below the Ichimoku cloud trading and both Conversion and Base Line. Then we should wait for a rebound upside towards the first resistance curve which is the Conversion Line. We open short position on the first test of the resistance in case if the RSI oscillator stays below the 50% level.
We add more volume on a test of the next resistance curve which is the Base Line with the same condition for the RSI oscillator. If price action does not come in line with the conditions described above, we simply ignore the signal. Stop-loss and take-profit orders are the same as for long positions but the opposite.
More strategies on Evotrade.
Interesting related article: “What is a Trader?“