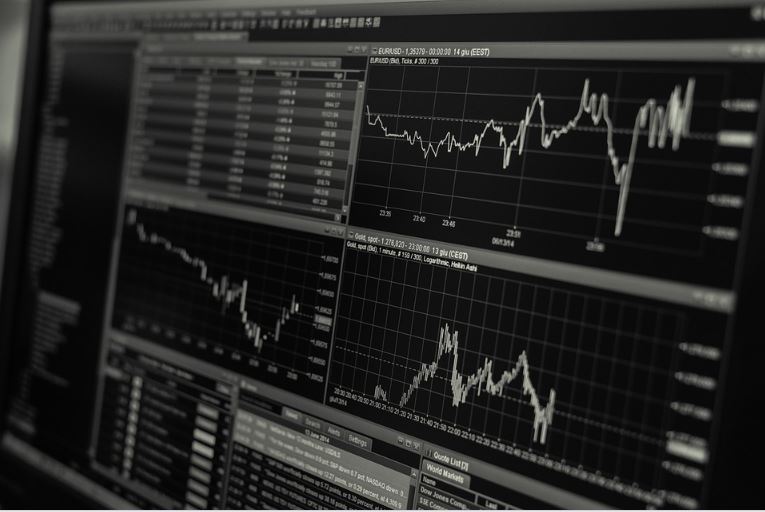
 Whether you are a small trader or the one dealing in big trading one of the most important aspect of trading is to understand the trend in the financial markets. Even before you start trading using different tools for technical analysis, reading patters and indicators are a must for every trader to improve the odds of success in trading.
This is why it is important to understand the trend in the trading market. Always remember one need to trade with the flow and need to identify when to enter and when to exit. Before everything else let us understand what is trend?
So once we identify a trend in trading a lot is shorted out. Trend in simple terms is defined as the direction of the market and it can be of three types: – uptrend, downtrend and sideways trend. In order to explain it better if the market is moving up it is uptrend and if it is moving down it is downtrend and if the market is neither moving upwards or downwards but fluctuating between two levels then it is sideways trend.
Identifying trends is important for each trader as he/she needs to understand that they can trade with rather than against a trend. In a simple way always remember that trend is your friend and if you understand it right you can take your trading on the path to profits. Here we need to know a lot can affect a trend as the news may also affect the market so be careful and know it better. Trader can identify trends in various forms such as technical analysis, trend lines and even technical indicators. Lets us talk about simple ways to identify trends in the market and how to deal with them.
The Line Graph: Simple way to read the trends
Though most of the traders use bars and candles when it comes to observing charts however they forget a very effective way and a simple tool the line graph. A trader should clearly zoom out the line graph in order to understand and get a clear and fair picture of what is happening in the market.
Each trader should do this activity at least once a week. Line graph is a perfect tool to identify the market trend and know what is happening in the market.
Read the market highs and lows
Another important tool is to read the highs and lows of the market through the price chart. This is again a very common tool to analyse what is happening in the market. The chart indicates a high when there is an uptrend when the buyers in the markets are in majority and push price up and lows are higher too when the buyer keep buying on dips.
In a similar manner during a downtrend lows are lower when the seller surplus moves price lower and highs are lower because sellers sell earlier while buyers are not interested.
Remember Highs and lows define the market and one needs to follow the highs and lows to understand what is market telling us.
Moving averages
Moving averages is again a popular trading tool which helps in understanding the market direction. With respect to moving averages one needs to pay attention to the length of the moving average which highly impacts when you get a signal on market turn.
A small and fast moving average can give you lot of early and false signals and it can be risky to react soon on those signals.
A slow moving average might provide signals too late and thus you may miss out on the trend.
Thus read moving averages wisely and take a call accordingly.
Channels and trend lines
Channels and trend lines are another way to identify the direction of trend and help you understanding the market better. While moving averages and analysis of high and lows help you to understand the market better in early trend stages trend lines help you recognise and read the market in the later stage as you need a minimum of two touch points to draw a trend line.
There are many more and various other ways to identify an read a trend in the market however one needs to stay focussed and recognise the smallest signal which can affect the market.
Video – Traders buy and sell goods or services
There are literally hundreds of different types of traders across the world. There are, for example, currency (forex), stock, commodity, fruit, vegetable, cattle, and market traders. This video, by Market Business News, explains briefly what they do.

