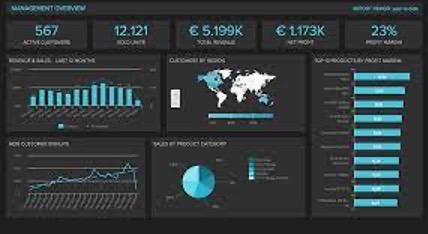

Do you what is dashboard designer software? Don’t know about this? There is no need to worry about it.In this article. We’ll decipher each and every aspect of this software. So, let’s get into this!
Dashboard Designer
This software is a data visualization and business intelligence tool integrated into one package. It helps businesses and organizations better understand data, make smarter business decisions, design and execute effective strategies, and discover actionable insights with high quality to achieve their goals in the fastest and most efficient way. Users have extensible data analysis software that can easily configure to gain access to business intelligence. The intuitive drag-and-drop interface has unlimited dashboards and a variety of charts that allow you to dig deeper into your data and understand everything without extensive SQL and database expertise.
The data connector can quickly collect the necessary dashboard information from various data sources, including related data, ERP and CRM programs, flat files, or online sales data. With all the data in one place, you can quickly analyze the database using drag-and-drop operations. This software allows you to visualize patterns and intangible relationships. Using specialized software, you can fully utilize data power and create additional value.
Key Features Of Dashboard Software
Using the latest online dashboard software, you can create beautiful charts and dashboards with complex architecture and other updated features. Well-designed dashboards can save time and help viewers quickly see the essential details of making informed decisions. It facilitates the transfer of this vital information to a standard web browser in an exciting way. Online dashboard software should include a variety of building materials and functions so that you can customize dashboards and charts to meet the needs of your particular business.
- Insert objects for each style such as graphics, pictures, text or picture blocks, frames, and lines.
- Arrange and measure charts, tables, and indicators as needed.
- Use interactive dashboard features, like earth dashboard filters, hierarchical filters, drill-down, and visual effects. Or use advanced filtering options as shared graphs.
- Use pre-built themes and dashboards to build your first dashboard with just a few clicks.
- International text editing styles or color correction options, including single data setup KPI chart labels and chart labels.
Benefits Of Dashboard Design Software
To make the most of your messages, you need to follow simple dashboard design rules: use the suitable kind of charts to show the most sensitive details, find the right layout without cluttering the page, provide the context of the data, and be creative. Can do it done quickly with the help of professional panel designers. Will discussed principles these methods and in more detail later.
Choose the correct chart or graph: Different charts give different answers to different questions. The Dashboard Designer tool lets you choose from a various of libraries, such as charts, bar graphs, slope lines, spider webs, maps, heat, charts, etc., to add sound to your electrical tools.
Graphs and layout: Graphics layout and complete structure play an essential role in the design. It is necessary to observe some basic principles of visual composition and colors shown on the board.
Remember Collaboration: One of the essential tips you can follow when using a trading dashboard is to take advantage of collaboration and go deep into the data set option downhill, which will show you what the chart is hiding.
Report Automation: Change dashboard reports, so you do not need to update daily, weekly and monthly data. This allows notifications to be sent regularly without the need for manual updates. Updates are done automatically with the panel.
Manage Your Important Numbers And Your Free Dashboard Design
Dashboard editing tool provides you with important information about your company to easily display your KPIs as needed. We have created more than 80 templates for various industries, business activities, and forums. Another level of customization has been added to our widget list, allowing you to zoom in, zoom out and zoom in for further investigation, move the timeline, group by week, month, or year, or filter the entire dashboard by terms and values! It’s your decision!
Conclusion
Organizations have different needs and requirements, and there is no suitable software platform for these conditions. It makes no sense to find the ideal, ready-to-use software system to meet all your business needs. The wise thing is to customize the solution to your employee’s skill level, finances, and other factors. For these reasons, you don’t have to rush to pay for significant well-known applications. It is widely used and may not fully meet specific requirements. We see how experts rate this in reviews when deciding to buy business intelligence software, and the actual people and companies who buy it are pleased with the product. I know it’s essential to find out if you have. You can access your data anytime, anywhere as long as you are connected to the Internet through a secure Software as a Service (SaaS) infrastructure. In general, the interface is very intuitive and can be used by business users as well.
For more information, click here
Interesting Related Article: “Web Design Trends“

