There are many things a novice trader would hear when they are starting out. They hear about the argument of Forex Vs stocks. People would give all sorts of advice. Never go full send, set up your trade in a way that you would not lose more than 2% of your balance in any position, etc.

One of these things is to not try and call tops and bottoms. You cannot really eyeball the charts and know when the selling and buying pressure are rising or fading. This is where indicators come in. For this purpose, you would need the Wave Trend Oscillator.
What is Wave Trend Oscillator?
Forex educators – The wave trend oscillator Investopedia definition is that it is a technical tool that creates high and low bands between two values. It then creates a trend indicator that draws waves with highs and lows within these boundaries.
The Wave Trend Oscillator, or WT oscillator, is the most effective indicator in identifying swings. That means this is an important tool to implement in a volatile market. It delivers the functionality of two technical indicators. It looks for the opening and closing of a new wave trend movement as well as overbought and oversold areas.
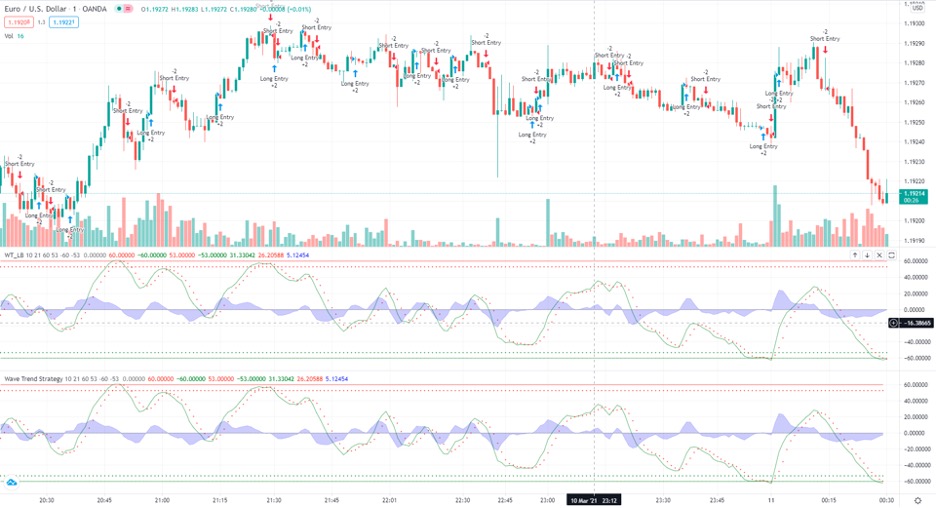
The indicator shows key levels between -50 and 50. A wave trend trigger for buying appears as a dot between -50 and -60. Conversely, a sell signal shows up as a dot between 50 and 60.
Given its popularity, you can see this indicator almost on every platform. You can get a wave trend oscillator MT4 on the MT4 website. If you use TradingView, there is an open-source script from LazyBear. If you use MT5, there is a wave trend oscillator MT5 as well. There are also user-created scripts for wave trend oscillator AFL or Amibroker.
Wave Trend with Crosses (LazyBear)
Forex trading for dummies – One of the most widely used Wave Trend oscillators would be one from a user named LazyBear. He created a wave trend oscillator with crosses (WTwC), which is very helpful in increasing a trader’s chance of catching the top. You can download it in the TradingView’s Scripts section. Some traders use it to identify entry points, waiting for extreme numbers to show up, and then place some small trades in an attempt to catch a trend reversal.
WTwC is similar to RSI, but it is slower (in a good way) and gives accurate results on the daily and 12-hour charts. If you go below the 12-hour timeframe, you might still get fairly accurate results, but there may be more noises.
The best thing about this custom indicator is that it is fairly straightforward. The code is very readable that even an average person with little to no coding experience can figure out how it works. For instance, the obLevel and osLevel are for overbought and oversold levels, which set the upper and lower limit of the indicator.
Given that this is an open-source script, you can tinker with the code and improve upon it. Many people have tried tinkering with the codes and posted their results in the comment section. You can also find LazyBear’s script on useThinkScript if you want to use wave trend oscillator ThinkorSwim. You can find it under BenTen’s post in 2019.
Wave Trend Strategy (Lazy Bear)
From LazyBear himself, the strategy is very simple. If the oscillator goes above the overbought band (red line) and crosses down the signal (dotted line), that it is typically a good time to sell. On the flip side, if the oscillator goes over the signal and below the oversold band (green lines), then it is a good time to buy.
A user on TradingView also put together an indicator called “Wave Trend Strategy (Lazy Bear)” to help others identify long and short entries with many other statistics to help you plan your move.
Of course, as with any indicator, it is not wise to use it alone. It is always better to use more than one so their readings can provide a stronger signal and confirmation when you need to make a move.
Also read: Simple moving average trading strategy
Other Wave Trend Strategies
Using the Wave Tend Indicator might be a risky prospect depending on your strategies. Make sure you have a solid one first. Here is a relatively simple one. You can use the most advanced and technical indicators without any additional filters since their range of application is narrow. You do not need to tinker with it further unless you know exactly what you want.
Make sure to use the Wave Trend Oscillator with other indicators such as trend indicators. So, here is what you do.
First, we will talk about entering a long trade. Ideally, you want to start trading during the European session. During that, you can start the Wave Trend Oscillator. It will draw a dot close to level 60, but not below 50. In the next 5 hours or so, wait until the wave trend dips and pins a dot close to level -60, but not higher than level -50.
The lines connecting these dots should look pretty straight without noticeable local extremes. Immediately after the dot, you can enter the trade at the next bar. There’s no need to aim for that high a profit. Usually, around 10 pips should be enough. Of course, you should place a stop-loss in case anything goes wrong. In this case, place it between 10 to 20 pips.
Next, let’s look at entering a short trade. Again, try to trade during the European session. Wait for the moment for the wave trend to pin a dot close to -60, but not more than -50. From that to the next five hours, wait until the wave trend goes up and draws a dot close to 60 but not lower than 50. Again, the line should look pretty straight without any notable local extremes. You enter the trade the same way with the long trade. Go in at the next bar, set your sight on gaining about 10 pips of profit, and set a stop-loss between 10 to 20 pips.
This strategy assumes that you are using MT4 to trade, where the dots would appear after you install the wave trend oscillator. However, if you trade on other platforms, you can just look for the points of intersection. The trade signal occurs when the fast- and slow-moving average intersect.
These are the red dotted and green lines that move together on the chart, not the two lines at the top and bottom. If they intersect in the oversold zone, MT4 draws a dot there and is a signal to buy. If they intersect in the overbought zone, MT4 would draw a dot in that area, indicating a signal to sell.
There are more ways to utilize the wave trend oscillator. Some can get very technical and involve the use of other highly advanced indicators that novice traders would not understand. For this reason, it is better to seek out a Forex mentorship program.
One of which is AsiaForexMentor. They offer a high-value course package and their mentor and founder is very experienced in the field with plenty of experience to his name. Go check out their website and download a few course sample that is invaluable to many Forex traders.
Interesting Related Article: “What is CFD Trading?“