A technical analysis indicator, a Pivot Point, assists you in determining support and resistance. It is calculated using OHLC (Open, High, Low, and Close) data. The intraday levels for today are based on OHLC data from the previous day.
If the market trades above the commodity pivot point in the following period, it is considered bullish, whereas if it is trading below the commodity pivot point is considered bearish. Pivot points are popular intraday indicators for stocks, futures trading, and commodities. They are effective tools for generating commodity tips today if used wisely.
Types of pivot points
Pivot Levels can be computed using Classic, Camarilla, or Woodie formulae.
As we’ve discussed, Pivot Points are theoretical support and resistance levels derived from open, high, low, and close values from the previous day: PP, R1, R2, R3, S1, S2, and S3. PP denotes the Pivot Point, resistance levels R1, R2, and R3, and support levels S1, S2, and S3.
Classic Pivot Points
This is a simple average of the close, high, and low values. The first and most important level of support (S1) and resistance (R1) is obtained by identifying the upper and lower halves of the previous trading range, which is defined by trading above and below the pivot point (H – P) and below it (P − L) respectively.
| Pivot Point (pp) = (h + l + c) / 3; | Resistance (r2) = pp +(r1 – s1); |
| Support (s2) = pp – (r1 – s1); | |
| Resistance (r1) = 2 * pp – l; | Resistance (r3) = pp + 2 * (h – l); |
| Support (s1) = 2 * pp – h; | Support (s3) = pp – 2 * (h – l); |
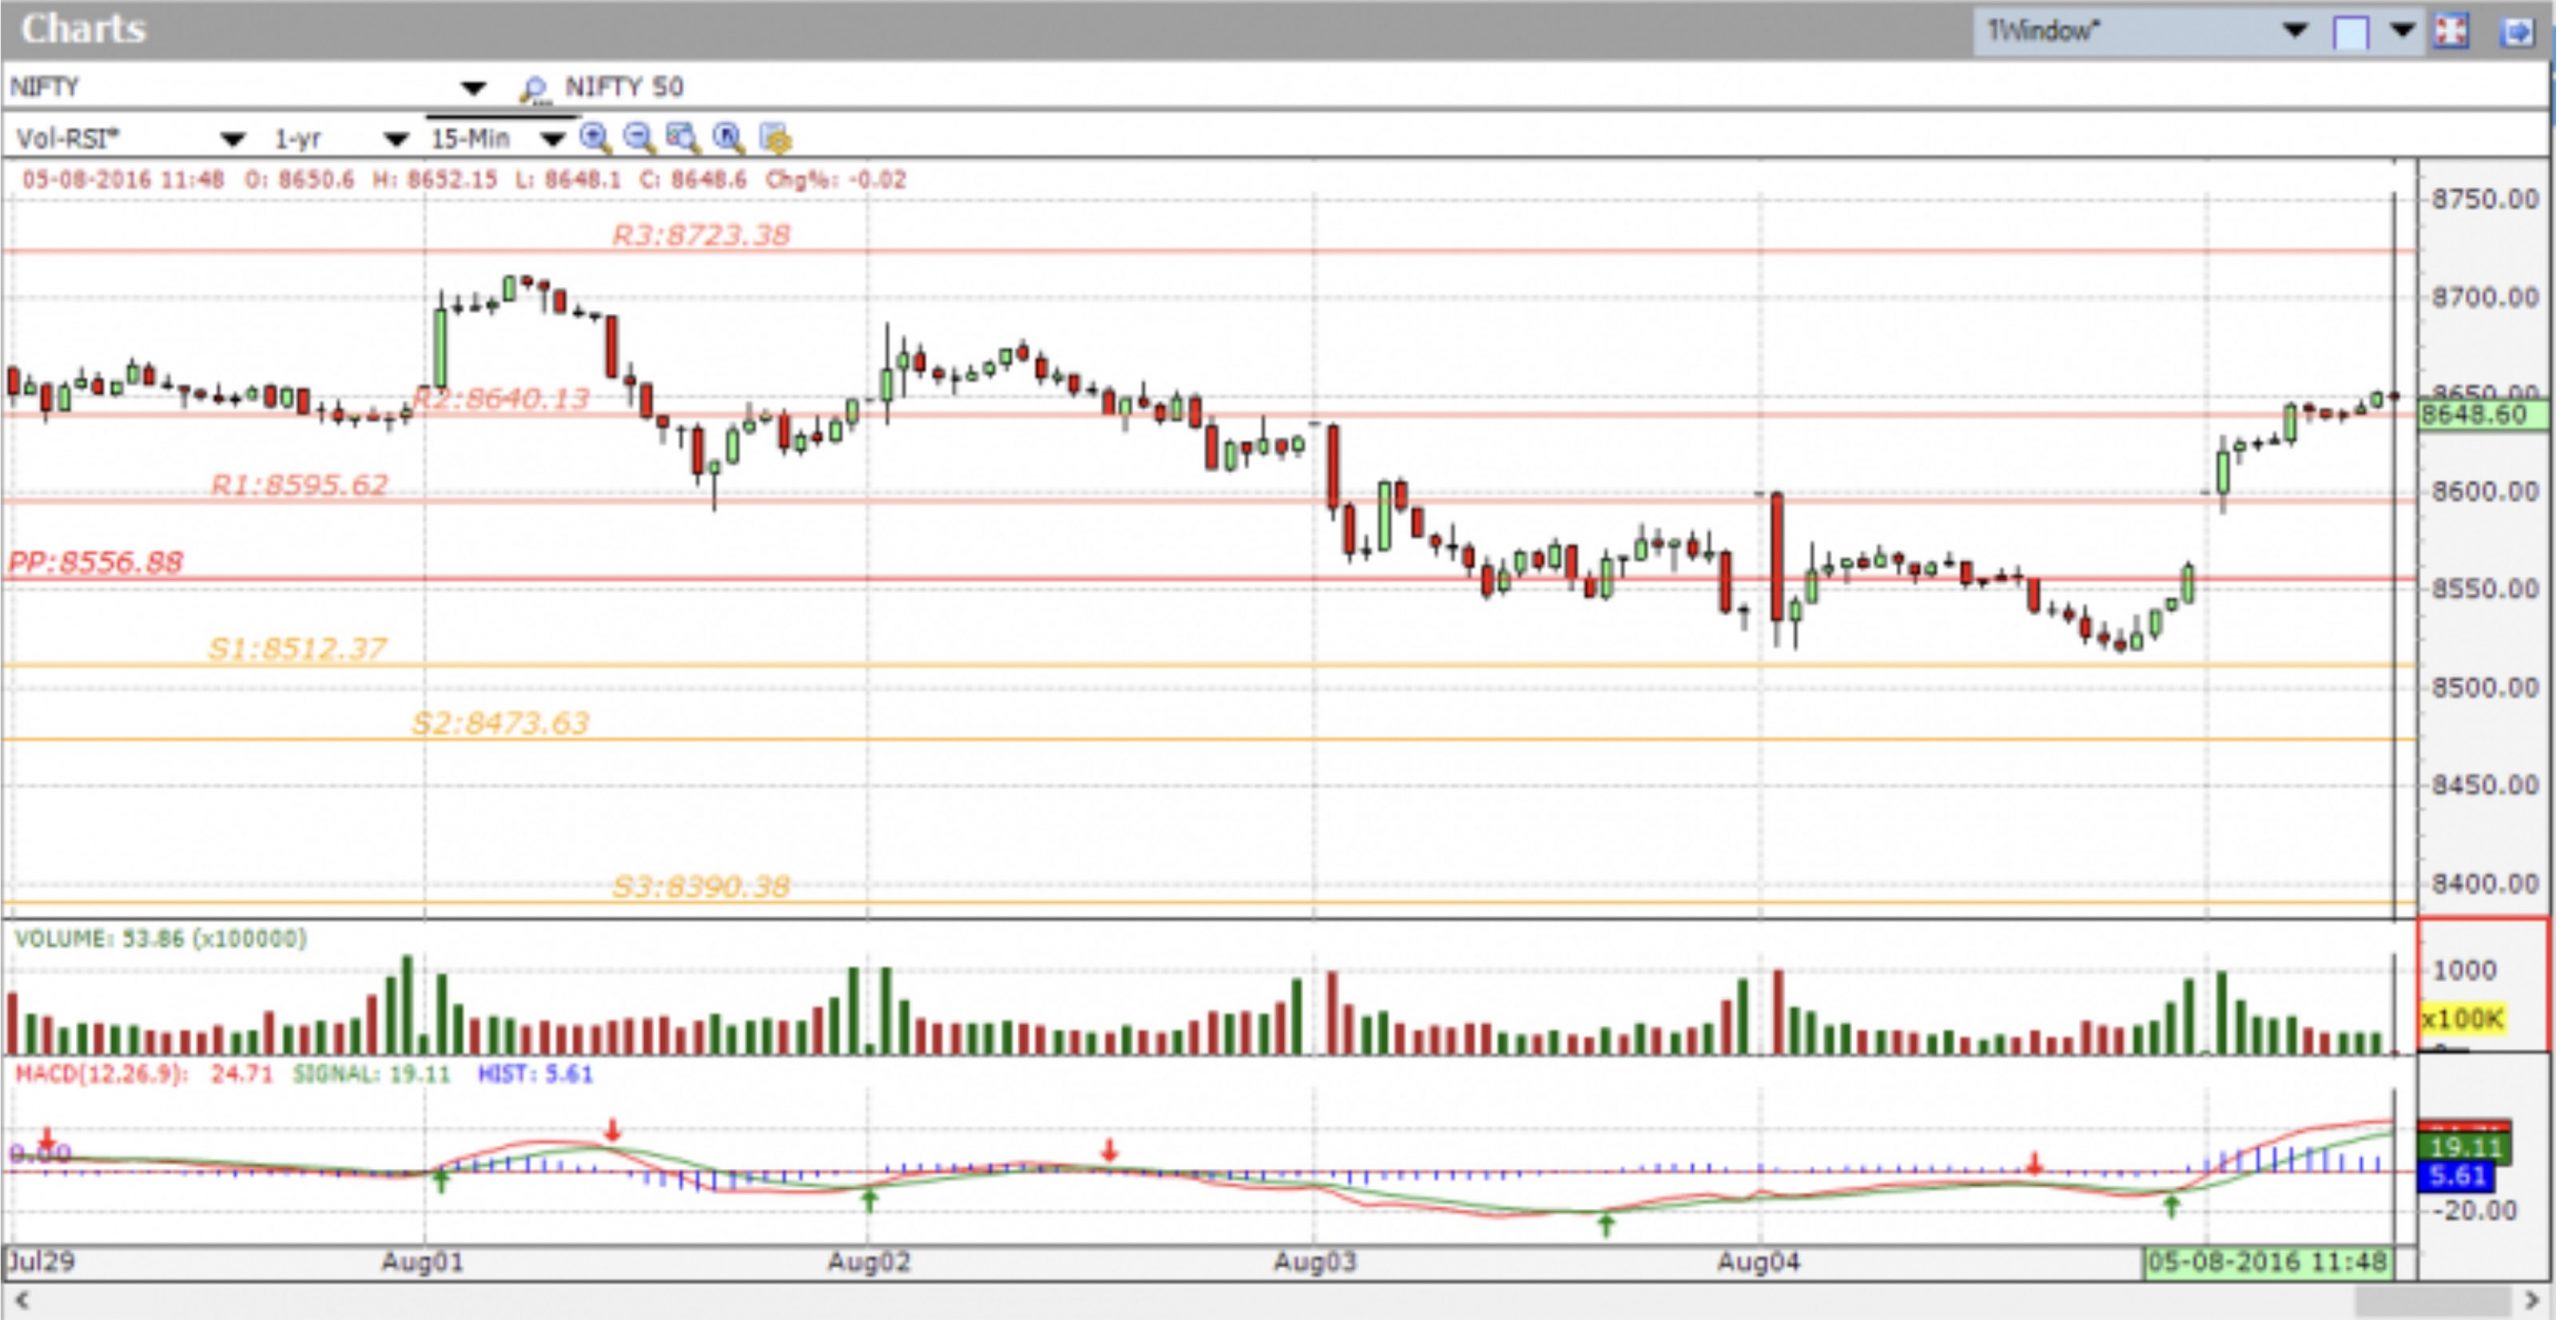
In the chart below you will see the Nifty 50 (Nifty) with Standard Pivot points in a 15-minute time frame. The Pivot Point is in the center, with support levels (S1, S2, and S3) below and resistance levels (R1, R2, and R3) above.
Camarilla Pivot Points
The Camarilla pivot point formula is an improved version of the classic pivot point formula. This formula makes use of the given time frame, such as daily, weekly, or monthly. Camarilla equations generate intraday support and resistance levels based on pivot points using the previous day’s high, low, and close.
| Pivot Point (pp) = (h + l + c) / 3; | Resistance (r2) = c + (h – l) * 1.1d / 6; |
| Support (s2) = c – (h – l) * 1.1d / 6; | |
| Resistance (r1) = c + (h – l) * 1.1d / 12; | Resistance (r3) = c + (h – l) * 1.1d / 4; |
| Support (s1) = c – (h – l) * 1.1d / 12; | Support (s3) = c – (h – l) * 1.1d / 4; |
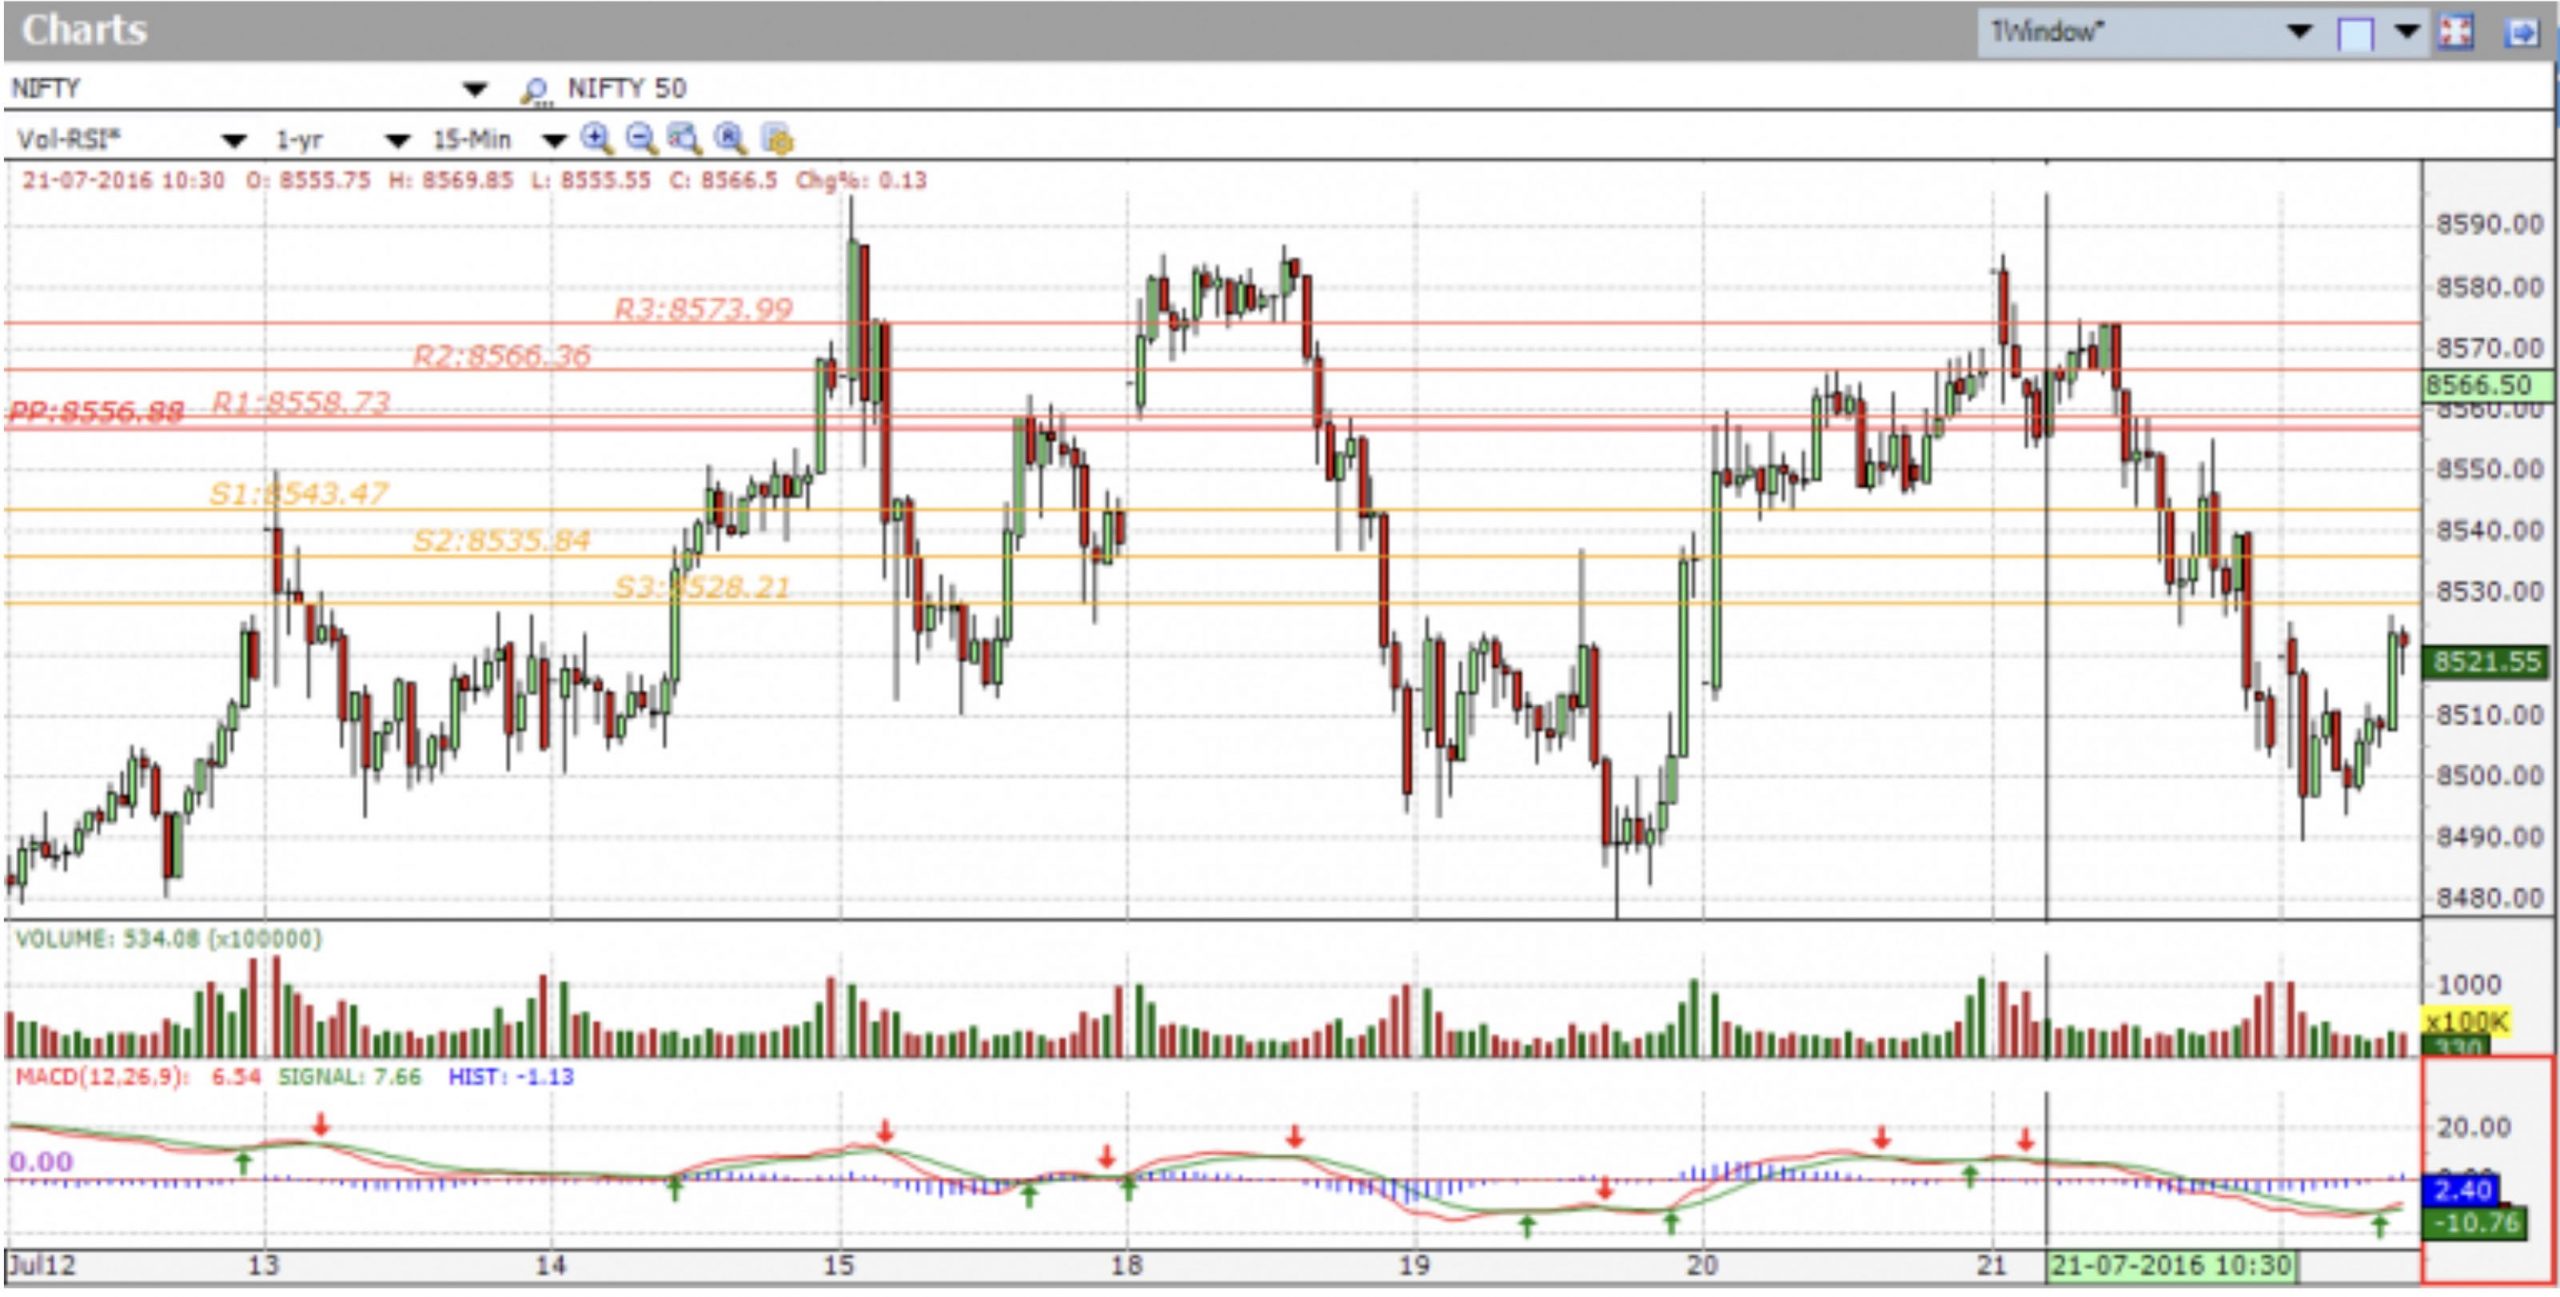
The chart below depicts the Nifty 50 (Nifty) with Camarilla Pivot points in a 15-minute time frame. The Pivot Point is in the center, with support levels (S1, S2, and S3) below and resistance levels (R1, R2, and R3) above.
Woodie Pivot Points
They are similar to classic pivot points, with the exception that Woodie ignores the previous day’s close price and emphasizes the current day’s open price.
| Pivot Point (pp) = (h + l + o + o) / 4; | Resistance (r2) = pp + (h – l); |
| Support (s2) = pp – (h – l); | |
| Resistance (r1) = 2 * pp – l; | Resistance (r3) = h + 2 * (pp – l); |
| Support (s1) = 2 * pp – h; | Support (s3) = l – 2 * (h – pp); |
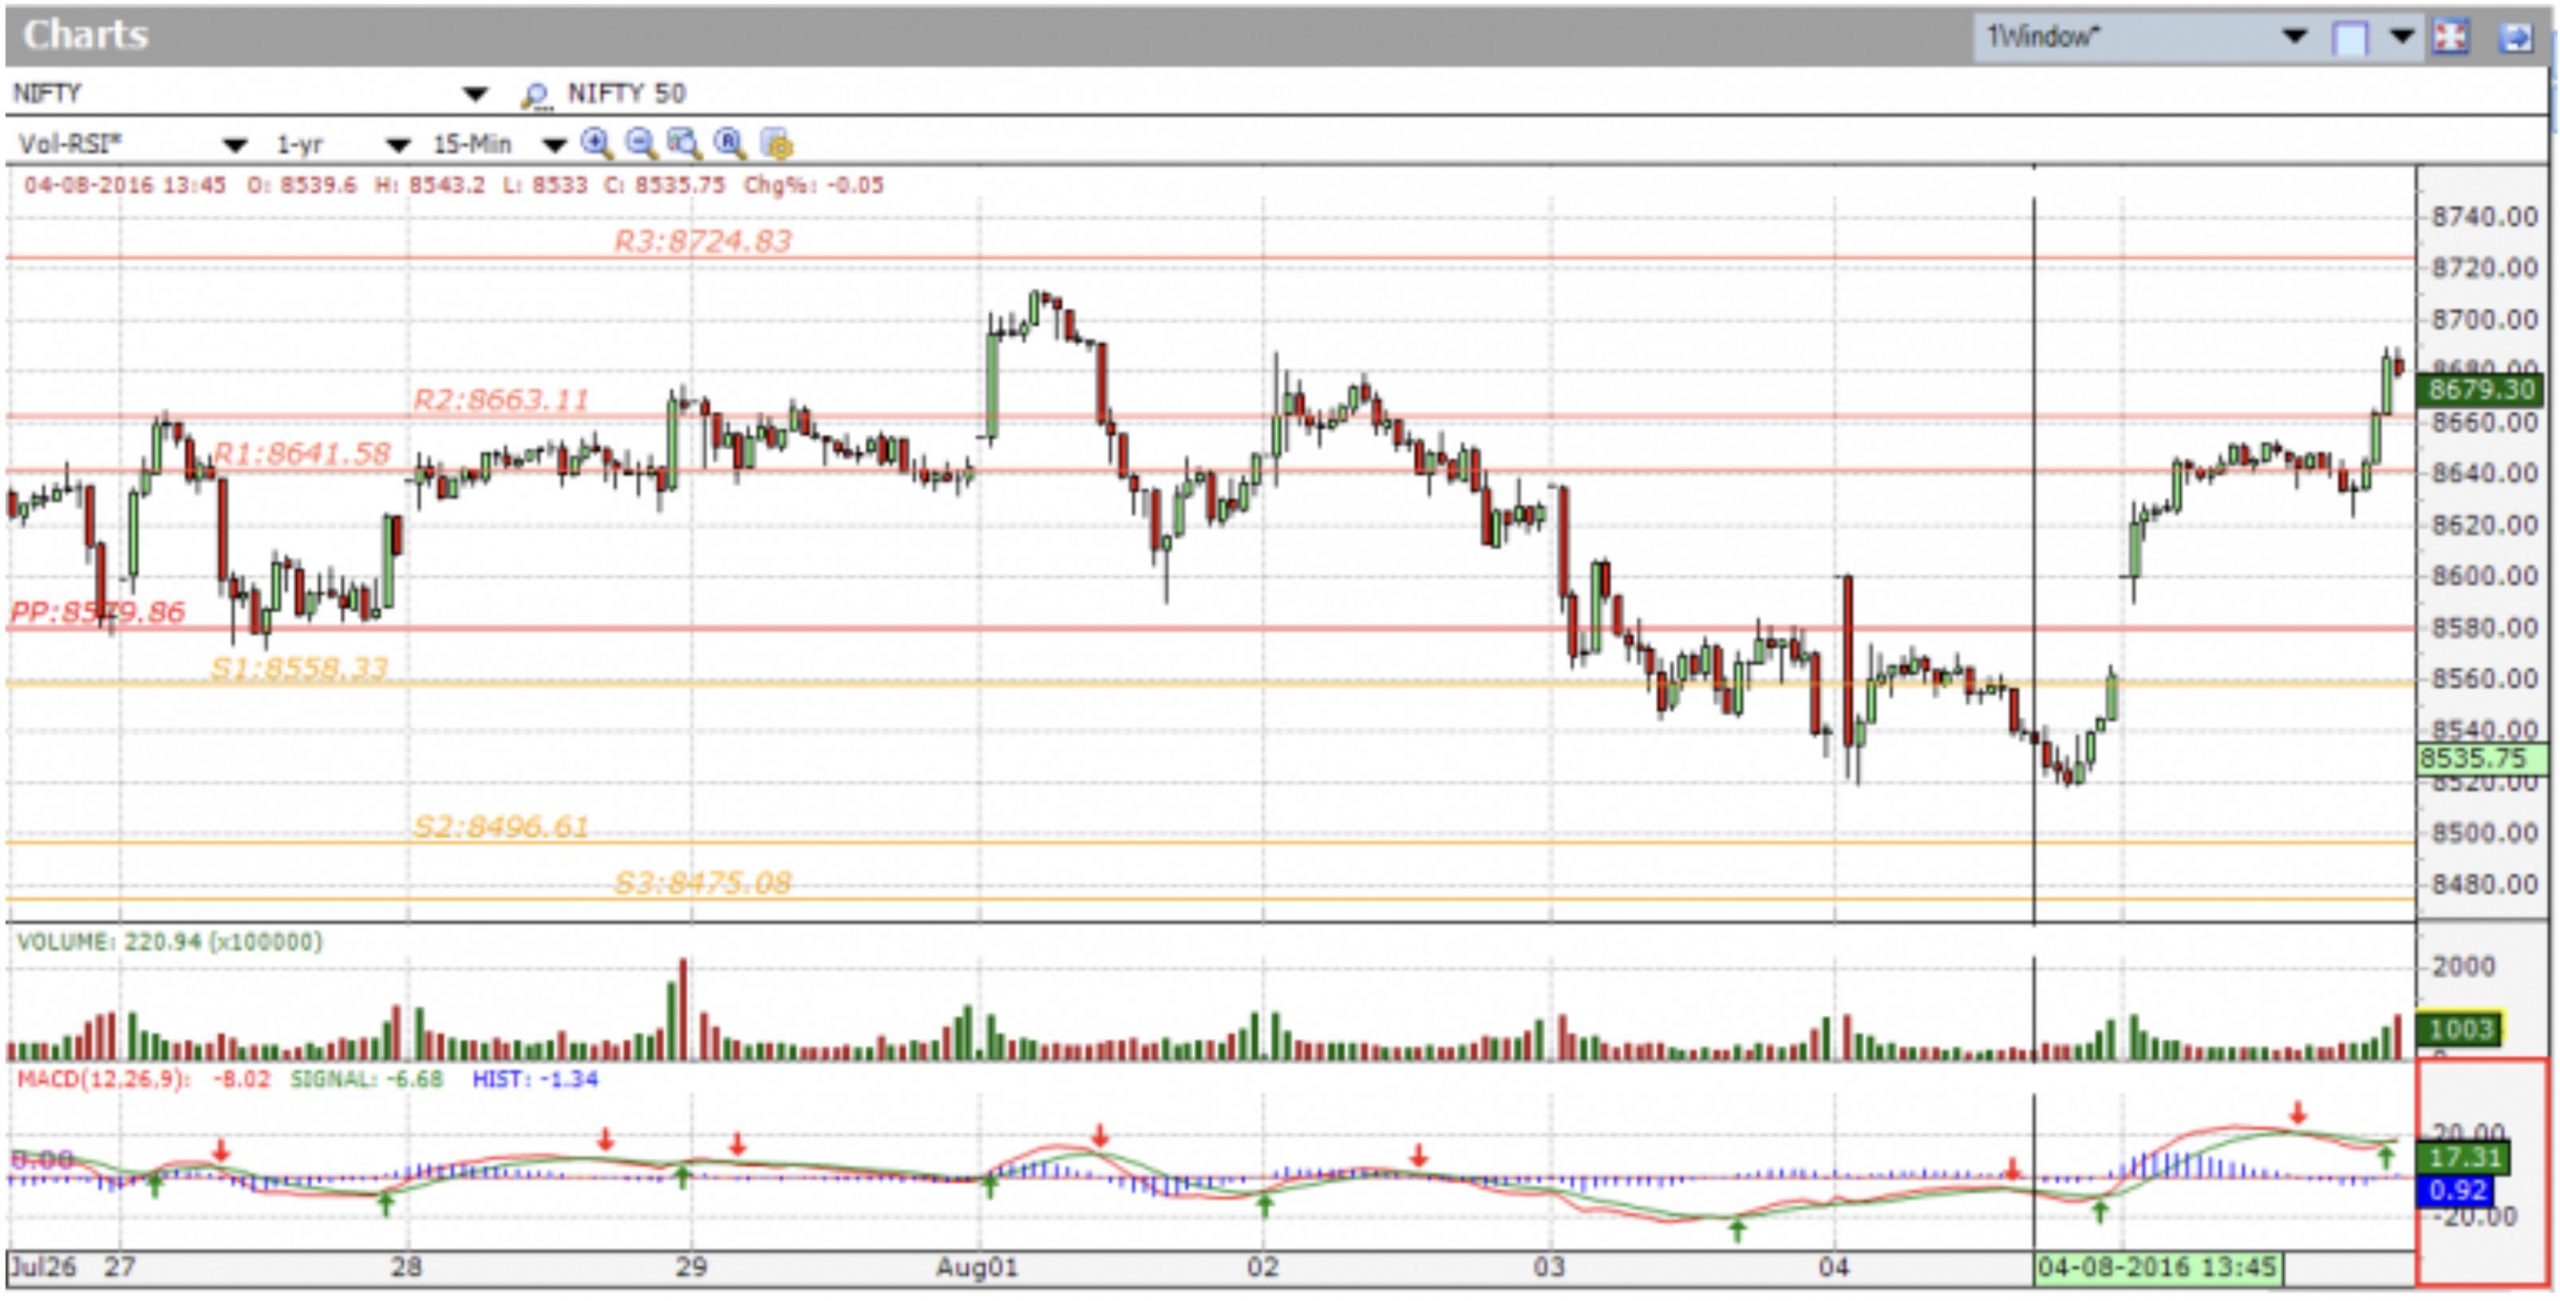
The chart below depicts the Nifty 50 (Nifty) with Woodie Pivot points in a 15-minute time frame. The Commodity Pivot Point is in the center, with support levels (S1, S2, and S3) below and resistance levels (R1, R2, and R3) above.
Pivot points are calculated theoretically to help identify support and resistance levels. However, the accuracy varies by stock, and they perform better on heavily traded stocks, most likely because other traders use them too.
However, they are not based on the stock price’s actual supply/demand. You must manually draw the support/resistance levels on the chart through peaks and troughs to obtain the support/resistance levels due to actual supply/demand.
You may be interested in: What is a percentage point? Definition and meaning