What is a Sales Report?
A Sales Report is an analytical tool used to view the past sales performance of the product/service in the market. It gives clear visibility of the progress of various sales activities inside the company in detail. The meaning of a sales report can be understood well by knowing its importance, types, and uses in a business. Sales reporting also paves the way to identify the skill gaps, marketing mistakes, and any other areas that need improvement. Sales reports are an integral part of any business to run successfully.
Importance of Sales Reporting
For a business to flourish in the future, a proper sales plan is required. Sales reports help you to make optimized use of the resources available and enhance the sales process. Also, the insights you derive from the sales reports help correct your sales strategies and adapt to the changing business environment. In short, you would be able to know your sales team’s strengths and weaknesses. Based on your business needs, reports can be prepared weekly, monthly, or yearly too. So, irrespective of your team size and revenue, it is important to prepare and analyze the sales reports periodically.
Types Of Sales Reporting
Based on the frequency, goal, and CTA (Call-to-action), you should choose the type of sales report that fits your requirements. Also, know who your audience is and prepare the report based on that by choosing the right metric. Lystloc app provides a customizable report feature called Lystdata by which you can get automated reports to your mailbox on a subscription basis.
Here are some commonly used types of sales reports and there are many other specific sales reports available based on the business.
- Conversion Rate Report – Conversion rate is the most commonly used yardstick for measuring a salesperson’s performance. It is the rate/percentage of successfully converted leads to the total number of prospects approached. By using this report, businesses can easily track down the performance of the sales team, areas of improvement, sales strategies, etc.
- Average Deal Size Report – Average deal size is a crucial factor for framing your sales strategies. For example, if you have a target revenue of Rs. 10 lakhs for a quarter and the average deal size at present is Rs.1 lakh, then you have to acquire 10 clients to achieve your target within that quarter.
- Sales Calls Report – No. of calls made by a sales rep can be tracked and a report can be generated based on that to measure their performance. Also in the case of field employees, no.of sales visits (client meetings) done can be noted. Lystloc is one of the leading field workforce monitoring apps used to record all the on-field activities of the sales team improving their productivity.
- Average Sales Cycle Length Report – This report is based on a time-bound metric, i.e the average time taken by the reps to close the deal. The total time is taken from the very first meeting till the sale is the sales cycle length. A simple and straightforward approach to measure the salesperson’s performance.
- Lead Response Time Report – This report is a benchmark used to measure the effectiveness of the follow-ups made by your sales team. The quicker you get a positive response from your leads, the better will be the sales performance.
- Revenue Report – The revenue report is one of the commonly used reports by all businesses which gives insights based on the total amount of revenue generated in a specific time. This is an overall metric and should be used in combination with other reports to measure salespeople’s performance accurately.
- Customer Churn Report – Most businesses concentrate on retaining their existing clients which is the best way to sustain them as they are the major source of revenue. A customer churn report analyses the impact of a customer churn on the revenue of your business in the upcoming months.
Steps To Create a Sales Report
- Start with a precise summary keeping in mind the goal and audience to bring out the meaning of the sales report completely.
- Choose the right metrics, based on which you are going to present the data. Deals won, revenue generated and any other highlights that add value to your report should be presented without fail.
- Show It Visually – Present the data collected with the help of visualizations, charts, and tables with examples to make it easily understandable.
- Draw Results – Interpret the data and conclude the data, on how you are planning to implement the strategies further.
- End With an Action Plan – Sales reporting is never complete without an action plan. If you have found any loopholes in the existing strategies, conclude the report with the solutions you found to overcome them in the future.
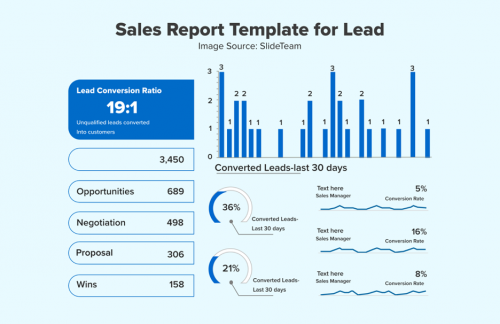
Sales Report Example
The below example is a sales report based on the conversion rate type. It shows the % of conversion rates for different sales managers of a company and it varies from one manager to another.
End Notes
Sales reports give an overview of all the sales operations going on in the company. They are also a visual representation of the sales KPIs which should be monitored continuously to propel your business forward. Also, a sales report should be well-structured and easy to interpret. Using a tool like Lystloc makes the sales report preparation much easier and helpful in drawing accurate insights for your business. Leverage the power of such sales reports to achieve your targets on time.
Interesting Related Article: “4 Things Every Business Needs to Become a Success“