Data visualization is a powerful way to interpret data in a graphical form, such as a pie chart, graph, table, or other convenient formats. Info visualization facilitates the perception of complex information and makes it more accessible. Creating a good data visualization is a complex process. However, many effective tools will help you easily cope with this task. One of them is WordPress themes for businesses that come with tables embedded.
Do you want to learn how to organize information with the help of the Elementor table? We will give you quick guidance on using this solution that presents data more effectively and systematically.
Who Might Need this Information?
Professionals from all kinds of industries will find this article beneficial, including:
- With the help of a well-designed table, they can increase brand awareness and form loyalty among customers.
- The financial sector and IT. Experts in this field need to simplify data and visually present their projects.
- Educational establishments. This type of infographic allows you to present educational material in a visual form and make it memorable.
- Government agencies can use it to publish statistics and census results.
- Non-profit organizations need it to attract public attention.
Where to Start?
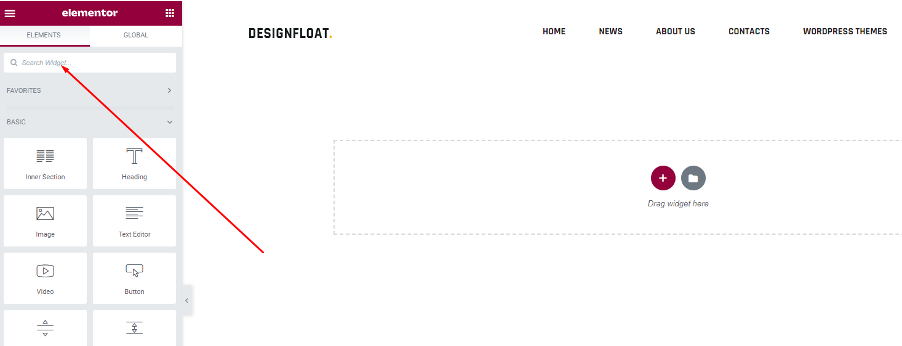
If you have a WordPress website, get an Elementor table widget. With its help, you can create feature-rich tables and customize them right inside the page builder. Press Edit with the Elementor tab, and you will get a similar page. Search for tables in a search bar.
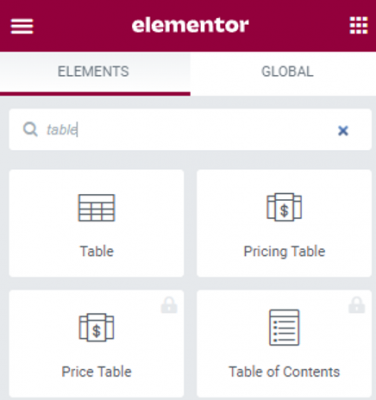
You will get a choice of a simple table, pricing table, price table, or table of content. Choose the suitable one.
Select an option you need and locate a widget in the center with the help of the drag and drop method.

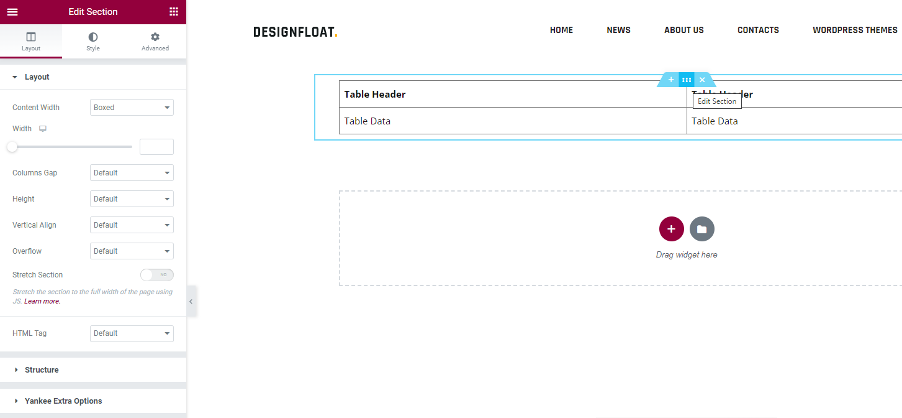
Once you decide on the widget you need, you will see a menu on the left-hand side. Here are all the actions you can do to alter a table to suit your needs.
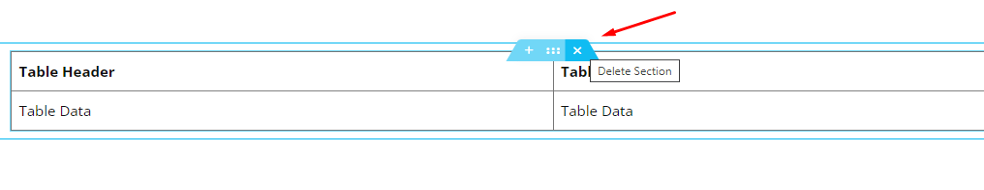
If you wish to add a new section or delete an existing one, press the + or X on your table.

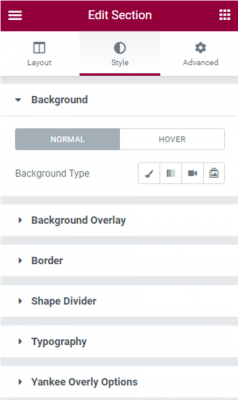
To change background type, borders or topography, go to the Style section.
How to Create a Visually Appealing Table?
You can go through several steps to design an Elementor table that will be useful for your readers. These steps are:
- Analyze the target audience. Think about who your audience is? Who are you creating this table for? What would they be interested in knowing? In what form will it be easiest for them to perceive and remember information?
- Formulate one specific question that your table will answer. For example: “Which phone is better to choose: iPhone or Samsung?” And create a comparative table that will help your readers find the answers they are looking for.
- Gather information. Make a document with all the information to be conveyed to the reader to understand the issue.
- Structurize and analyze. Prepare the table’s plan. Delete all information that is not critical to the disclosure of the topic. Form a logical structure.
- Visualization is important in tables, not text, so keep the text blocks short. Add visual images with which you can convey information to the audience.
Additional Things to Keep in Mind
Leonardo DaVinci once said: Simplicity is the ultimate sophistication. It means that whatever you do, try to:
- Keep it simple – sometimes, you can place only data visualization on the site without text and additional visual elements.
- For better understanding, you can add pop-up tips.
- Use white space effectively – the more complex the information, the more white space you need.
- Make elements responsive.
- Do not use too bright colors – monochromatic palettes are suitable for tables.
- If necessary, add headings or full paragraphs of information.
Elementor Tables and SEO
Structured information is always valuable. If an infographic answers the questions people ask, it’s bound to become popular. Creating something unique is worth exploring trending topics, popular queries, and other infographics dedicated to the same ideas. This is done to find out what users want. The combination of great information and visually appealing illustrations will make an infographic really valuable and even possibly viral.
Search engines work not only with key user queries in text form. Tables also play a big role in SEO. Plus, it’s a great backlink-building tool. Attractive, interesting tables shared on social media drive traffic to the site. If your infographic gets a lot of shares, search engines will help it rank higher for relevant keywords.
Our Final Thoughts
With the help of Elementor tables, you can easily structure and present any information. It is important to do so since The human brain is programmed to prioritize visual cues. Therefore, site visitors spend about 10% more time looking at infographics than reading text. Elementor tables enable you to creatively represent any information by combining text and graphic elements. An alternative would be to use a WordPress tables plugin with more features.
Interesting Related Article: “WordPress hosting: Why some hosting companies are better with WordPress?“