Modern marketers understand that data is possibly your most important tool for success. Collecting and analyzing your data can help you better understand your campaigns’ effectiveness, analyze your customers’ behaviors, and come up with new ideas for marketing strategies in the future.
Data itself is immutable; assuming you’ve gathered it correctly, it tells you a pure truth about the world. But if you’re not analyzing the data correctly, or if you’re not asking the right questions of your data, you could end up with the wrong insights—the wrong conclusions about your data.
Preventing Data Misinterpretation
The best solution to this problem is to work with a professional analytics agency—a team of professionals that has experience in data analytics. Niche experts are much more capable of anticipating (and preventing) common mistakes, while giving you the purest possible perspective on what the data is implying.
You can accomplish something similar by having multiple analysts working together on your team, assuming they have experience in data analytics. Multiple individuals can challenge each other’s innate biases and bring different perspectives and values to the table.
Otherwise, the best approach is to understand the most common ways people misinterpret marketing data, and be on the lookout to prevent them.
How You’re Misinterpreting Your Marketing Data
These are some of the most common marketing data interpretation mistakes people make:
1. Confirmation bias
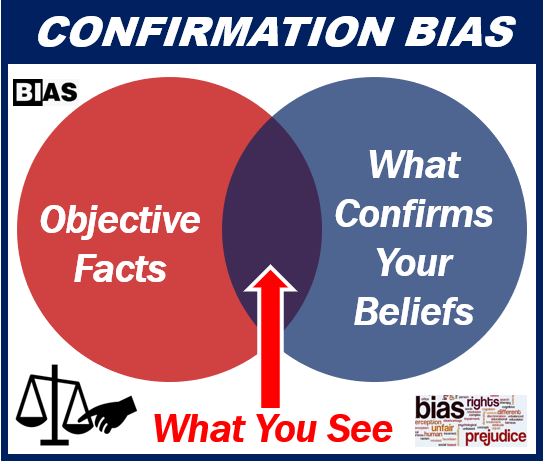
Confirmation bias is one of the most common types of cognitive bias, because there are so many ways it can manifest. Put simply, confirmation bias encourages us to disproportionately value evidence that already agrees with one of our foregone conclusions.
For example, let’s say you believe that your latest blog post is one of the best pieces of content on your site; you might point to the number of comments it’s attracted, while ignoring the fact that its bounce rate is higher than average.
2. Outlier ignorance
Data visuals like charts and graphs have become more commonplace because they’re simple, intuitive, and approachable to non-analysts. They help us spot trends easily—but general trends and patterns aren’t everything.
If you’re too focused on these big-picture movements, you’ll neglect outliers (instances that deviate from the norm). Even though they break the pattern, outliers can tell you a lot about how your campaign is functioning.
3. Internal traffic (and other noise)
By default, Google Analytics and other analytics platforms will “count” your internal traffic; in other words, some of those 10,000 monthly visitors your site is attracting is actually internal staff members trying to learn more about the business or looking something up. You’ll need to account for internal traffic, and other sources of noise, if you want a clearer picture of reality.
4. Visual reliance
Data visuals are fantastic tools that help people quickly identify patterns and intuitively grasp numbers that would otherwise be impenetrable. However, they also come with some weaknesses. No simplistic data visual can give you a complete picture of reality, so it’s possible you’re leaning too heavily on them.
5. Correlation and causation
Correlation does not imply causation; it’s easy to acknowledge this principle in a closed environment, but when you’re in the middle of studying the relationship between multiple marketing variables, it’s tempting to jump to “causation” immediately. For example, you might see a spike in traffic following an injection of new marketing funding, but are you sure this increased spending was responsible for the boost?
6. Comparing apples and oranges
To get a clear idea of how your campaign is developing, you need to compare “apples to apples,” studying changed variables in very similar conditions. By comparing “apples to oranges,” your analyses will cease to make sense.
7. Ignoring seasonality
Most marketing numbers ebb and flow seasonally, throughout the week, and even throughout the course of the day. These natural cycles can usually be measured and predicted, so they should be considered when you’re trying to analyze larger trends.
8. Asking the wrong questions
If you want to land on the right hypotheses and conclusions, you’ll need to ask the right questions of your data. What are you looking for? What do you expect to find? What would a deviation from those expectations mean?
It’s completely natural to misinterpret marketing data, and no matter how much you train or educate yourself, there’s a good chance you’ll keep making small mistakes here and there. However, you can take steps to minimize the number of mistakes you make when interpreting your marketing data—and attempt to make your conclusions as accurate and reliable as possible. Challenge yourself on these points when looking at the data first-hand and consider hiring an analytics expert to help you come up with better models long-term.
Interesting related article: “Data analytics for a modern business.”