
Knowing patterns and candles like the Doji can greatly help you to make optimal trading decisions. The Doji, representative of indecisive markets, denotes potential volatility and trend shifts. In this piece, we delve into the formation of the Doji candle and its utilization in enhancing trading strategies.
Key Attributes of the Doji Candle
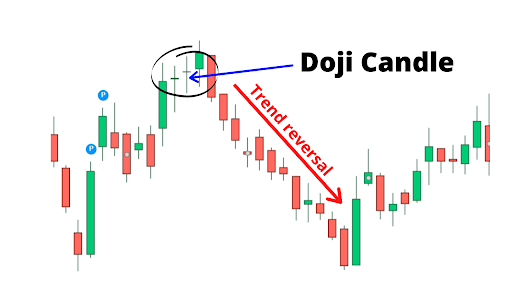
Appearing like a cross, the Doji candle or Doji star forms when market opening and closing levels are almost identical. Although they suggest potential trend alternations, Doji candles should be considered alongside other indicators for a thorough examination.
The Different Doji Patterns
The Doji candlestick embodies multivariate patterns that provide distinctive insights rather than exclusively indicating trend continuity or reversals.
- The Neutral Doji: This pattern denotes potential market apexes or bottoms, and market equilibrium given its near-identical low and high levels. It becomes particularly useful when combined with momentum indicators such as RSI or MACD.
- The Dragonfly Doji: Forming a ‘T’ shape, this Doji suggests a likely trend change. Its appearance at the end of a downtrend paints a picture of a potential uptrend.
- The Long-Legged Doji: This Doji exposes major price shifts and reflects market indecision. When it surfaces at a price swing’s top or bottom, a change in trend or momentum is expected.
- The Gravestone Doji: This pattern predicts a bearish reversal by featuring a long upper shadow. It materializes when prices increase throughout the day but close near the opening.
- The 4 Price Doji: This Doji forms when the opening, closing, highest and lowest prices coincide, hinting at high market uncertainty and possible trend alterations or consolidation phases.
Implementing Doji Candles in Trading
Doji candlestick patterns, emblematic of balance, frequently show probable shifts and uncertainty, indicating a pause before a course change. They should be used in combination with other indicators for a more holistic analysis.
Doji patterns can enhance a trading strategy when used with other analytical tools despite not being very strong signals independently. For instance, a Doji at a crucial support level could signal a bullish reversal, prompting a purchase order above the high price.
There are various ways traders utilize Doji candles. The Doji and trendline strategy shows a possible bullish reversal when a dragonfly Doji appears near the trendline support. The Double Doji strategy detects large breakouts following periods of hesitation.
Closing Thought
Doji candles are powerful tools for traders, signalling potential trend shifts and volatility. However, it is crucial to remember that Doji candles should not be used as standalone indicators but rather in combination with other analytical tools for a complete analysis of the market trends.