The Maltese economy depends on foreign trade, tourism, and manufacturing. Pharmaceuticals and electronics dominate its manufacturing sectors. On May 1st, 2004, Malta joined the European Union. On January 1st, 2008, the Maltese economy adopted the euro currency. Its market-oriented economy, the euro area’s smallest, relies strongly on trade with the European Union.
Maltese economy – 19th century
Since the Napoleonic Wars (1800-1815), the Maltese economy has gone up, down, and then up again. During the Napoleonic Wars, the country prospered and became the hub of a major trading system.
Two-thirds of the cargo consigned from Malta in 1808 went to Egypt and Levant. Later, half of all its cargo went to Trieste.
Most of Malta’s cargo consisted of colonial and British manufactured goods. The Maltese economy grew rapidly from this trade. Many artisans including weavers worked in the port industry.
From 1871 to 1881, approximately 8,000 people worked in the country’s docks. By 1882, after several banks opened in Malta, it had become a very prosperous island.

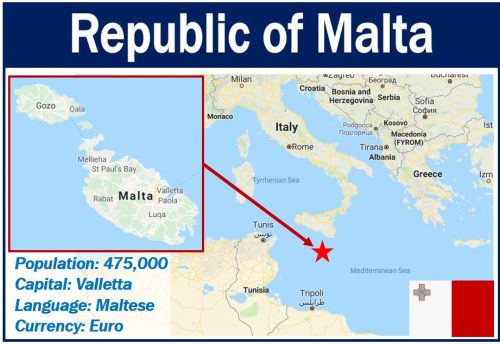
Wikipedia says the following about the Maltese Economy: “Malta is a highly industrialized, service-based economy. It is classified as an advanced economy by the International Monetary Fund and is considered a high-income country by the World Bank and an innovation-driven economy by the World Economic Forum.” (Image: adapted from google.com/maps)
Maltese economy – 20th century
At the end of the nineteenth century, the boom was over. For the next forty years, the country’s economy was in continuous decline. By the 1940s the Maltese economy was in serious trouble.
The economy suffered because large ships had become oil-fired. Therefore, they no longer had to stop in Malta’s grand harbor to refuel.
By 1945, Malta lost much of its strategic importance. Modern aeronautical technology had changed how air warfare was conducted, which undermined the importance of Malta as a military base.
After the United Kingdom lost control of the Suez Canal in 1956, it withdrew from the naval dockyard in Malta. The dockyard was transformed for ship repair and commercial shipbuilding purposes.
During the 1980s, tourism started growing rapidly. During the 1990s, Malta’s GDP grew steadily and at a brisk pace. GDP stands for gross domestic product.

Portomaso Business Tower, Malta’s tallest building. (Image: Wikipedia)
Maltese economy – 21st century
Ever since the late 1990s, the country’s economy has maintained an impressively low rate of unemployment. However, labor market pressures have grown, and skilled labor shortages are now widespread.
According to https://www.onlineautomatenspiele.net, Malta-licensed online gaming businesses had almost 800 unfilled job vacancies at the end of 2017. This was mainly due to a serious lack of qualified applicants.
Regarding Malta and the online casino sector, Onlineautomatenspiele.net says:
“Malta is a European country that continues to be one of the most popular destinations for online casinos to obtain gaming licenses. The jurisdiction has been providing this service since 2000.”
Since joining the European Union in 2004, the Maltese Government has pursued a policy of gradual economic liberalization. There has been a move away from direct government intervention and control. Policy regimes have favored a greater role for free market mechanisms.
Even though changes over the past decade have been considerable, the economy is still relatively regulated.
According to Malta.com:
“Malta managed to maintain a relatively low unemployment rate, mainly because of the constant growth and by policies encouraging continuous training for the labor force.”
“Globally, Malta ranks sixth in inward Foreign Direct Investment and amongst the top twenty among countries most likely to sustain economic growth over the medium and long-term.”
Maltese economy – highlighted data
Below are some statistics related to the Maltese economy (Source: Moody’s Corporation):
GDP (official exchange rate)
- $12.01 billion (2017 est.)
GDP – real growth rate
- 5.1% (2017 est.)
- 5.5% (2016 est.)
- 7.1% (2015 est.)
GDP – per capita (PPP)
- $42,500 (2017 est.)
GDP – composition (by end use)
- household consumption: 49.1%
- government consumption: 16.8%
- investment in fixed capital: 23.1%
- investment in inventories: -0.8%
- exports of goods and services: 145.4%imports of goods and services: -133.5% (2017 est.)
GDP – composition (by sector of origin)
- agriculture: 1.3%
- industry: 10.6%
- services: 88.1% (2016 est.)
Labor force
- 206,300 (2017 est.)
Unemployment rate
- 4.4% (2017 est.)
Budget
- revenues: $4.295 billion
- expenditures: $4.354 billion (2017 est.)
Public debt:
- 52.9% of GDP (2017 est.)
- 56% of GDP (2016 est.)
Inflation rate (consumer prices):
- 1.3% (2017 est.)