What is a J-Curve? Definition and meaning
The definition and meaning of a J-Curve is a type of graph, shaped like the letter ‘J’ – illustrating the trend of a nation’s trade balance immediately after its currency has been devalued.
A cheaper domestic currency means lower-priced exports in the global market, and dearer imports, which initially makes trade surpluses smaller or deficits bigger. This situation does not last long because soon export sales start to pick up due to their lower prices to buyers in other countries, and import volumes decline.
If a currency appreciates – increases in value – the graph is usually an inverted J-curve.
The graph has a J-Curve following a devaluation because imports and exports change very little initially – this causes a bigger deficit or smaller surplus in the trade balance. The time-lag between the currency devaluation and when the improved trade balance starts to occur is known as the J-Curve Effect.
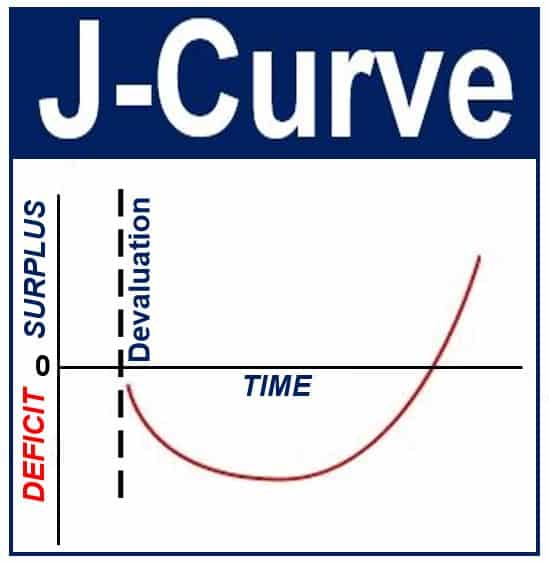 As this J-shaped graph of a country’s balance of payments current account shows, as soon as its currency is devalued, the deficit gets worse for a while, until the desired effect starts to kick in and the balance eventually goes into surplus. The valley period in the graph is known as the ‘J-Curve effect’. (Image: adapted from centralecon.wikia.com)
Trading patterns change gradually
There is no immediate big change in buying and selling patterns following a devaluation, partly because companies have pre-existing trade contracts that they must honor, and shoppers who need a product have not had time to look around for alternatives.
However, importers in a country whose currency has declined will soon start shopping around for cheaper domestic suppliers, whose prices overall have declined compared to those in the global marketplace, while foreign clients and shoppers will begin buying more.
In most cases, a devaluation of a currency will have the desired effect over the longer term – an improvement in the current account balance (greater exports and smaller imports).
According to The Economist, the J-Curve is:
The shape of the trend of a country’s trade balance following a devaluation. A lower exchange rate initially means cheaper exports and more expensive imports, making the current account worse (a bigger deficit or smaller surplus).”
“After a while, though, the volume of exports will start to rise because of their lower price to foreign buyers, and domestic consumers will buy fewer of the costlier imports.”
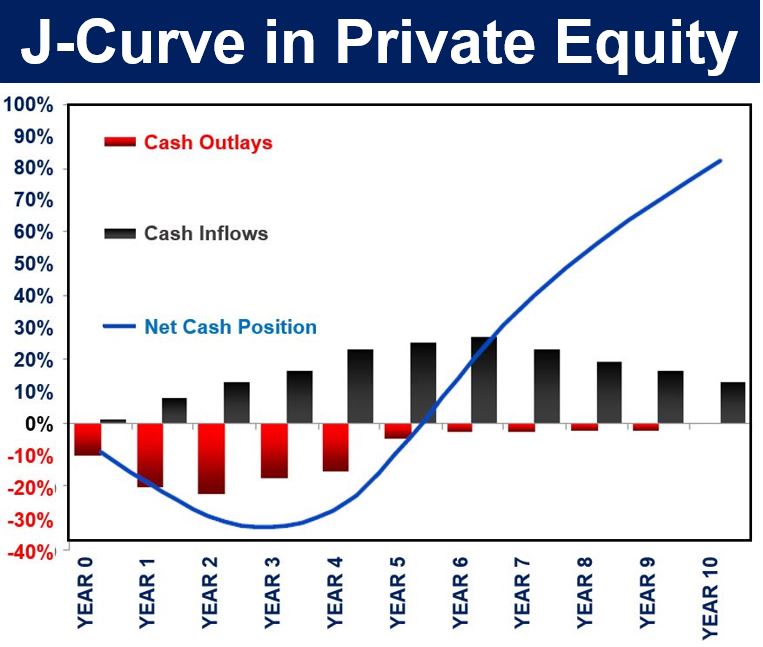 The J-Curve in private equity focuses on the premise that an internal rate of return at first falls until a level of stability is established, after which the investment enters into a profitable state. (Image: Adapted from Wikipedia)
Private equity – J-curve
The J-curve is also used to illustrate the historical trend in private equity funds in the early years, when they deliver negative returns, followed by positive gains later on as the portfolios of investments mature. Private equity refers to stocks and debts of private companies – ones that are not listed in a stock market.
Several factors contribute to the negative returns during the early years, such as investment costs, management fees, and under-performing investments that are detected early and written down.
Eventually, the fund will start to experience unrealized gains, followed over time by events in which the investment gains, such as initial public offerings (IPOs), leveraged capitalizations, and M&As (mergers and acquisitions).
The J-curve in private equity tends to be more pronounced in the United States compared to the United Kingdom and Western Europe. This is because private equity firms in the US tend to carry their investments at investment cost or the lower end of market value, and are generally more aggressive in writing down than writing up investments.
Consequently, the carrying value of any US investment that is under-performing is written down, while the carrying value of strongly-performing investments are generally only recognized when some kind of event occurs that forces the private equity firm to mark it up.
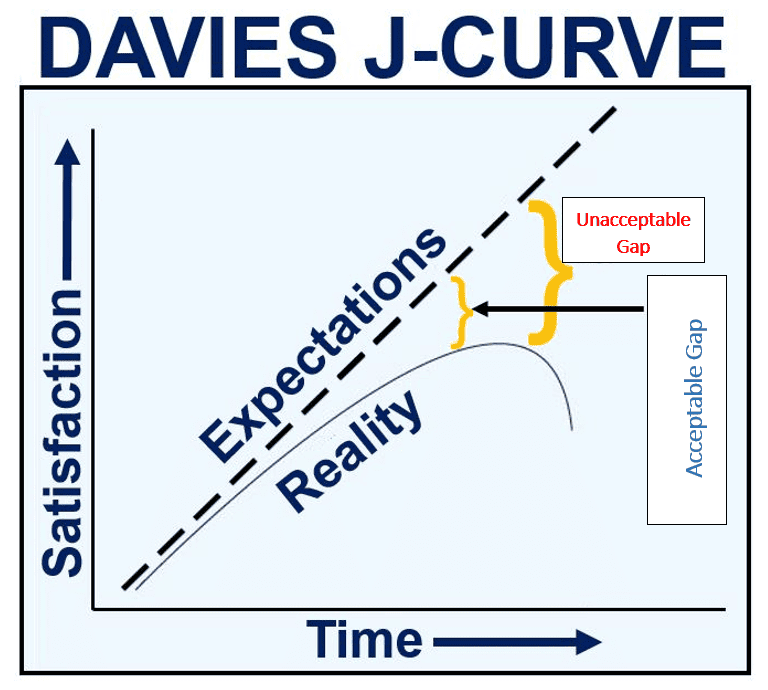
In the late 1950s, American sociologist James C. Davies developed a theory that rising expectations are related to the possibility of armed conflict, but only when growing expectations – brought about by, for example, a reasonable period of economic growth – meet a downturn. His theory became known as the Davis J-Curve. (Image: Adapted from nicborain.wordpress.com)
Davies J-Curve
The Davies J-Curve in political science is part of a model that American sociologist James Chowning Davies (1918-2012) developed to explain political revolutions.
Prof. Davies argued that revolutions are a subjective response to a sudden change of fortunes after a long period of economic expansion – the situation is known as relative deprivation.
According to relative deprivation theory, frustrated expectations help overcome the collection action problem, which in this case has the potential to breed revolt.
Frustrated expectations might be the result of a widening income gap within the nation, which means that individuals who are increasingly poor compared to their rich counterparts are receiving less than they expected.
Frustrated expectations may also occur during a crisis, if it was immediately preceded by a sustained period of economic growth, during which general expectations had been lifted.
Many people today believe that the post-crisis economic growth that occurred after the Great Recession, which saw the rich getting richer while the rest of society had to accept several years of below-inflation wage increases, contributed to Britons voting for Brexit – Britain Exiting the European Union – and Donald Trump winning the US presidential elections – anti-establishment voting.
The Davies J-Curve model is frequently applied to explain social turbulence and efforts by the authorities to contain the unrest. It is referred to as the Davies J-Curve, because GDP (gross domestic product) growth followed by a recession or depression would be modeled as an upside-down and slightly skewed letter ‘J’.
Video – the J-Curve effect
In this video, Shafiq Fakir says it is important to understand the J-Curve effect because it illustrates that time lags can have an effect on economic variables, which may be the opposite of what we expect.