2015 was the hottest year ever globally over land and ocean surfaces while December broke the record too, says a new report issued by NASA and NOAA (National Oceanic and Atmospheric Administration). December global land and ocean average surface temperatures were also the hottest since records began in 1880, or 136 years ago.
The average temperature across land and ocean surfaces worldwide in 2015 was 0.90°C (1.62°F) higher than the average during the 20th Century.
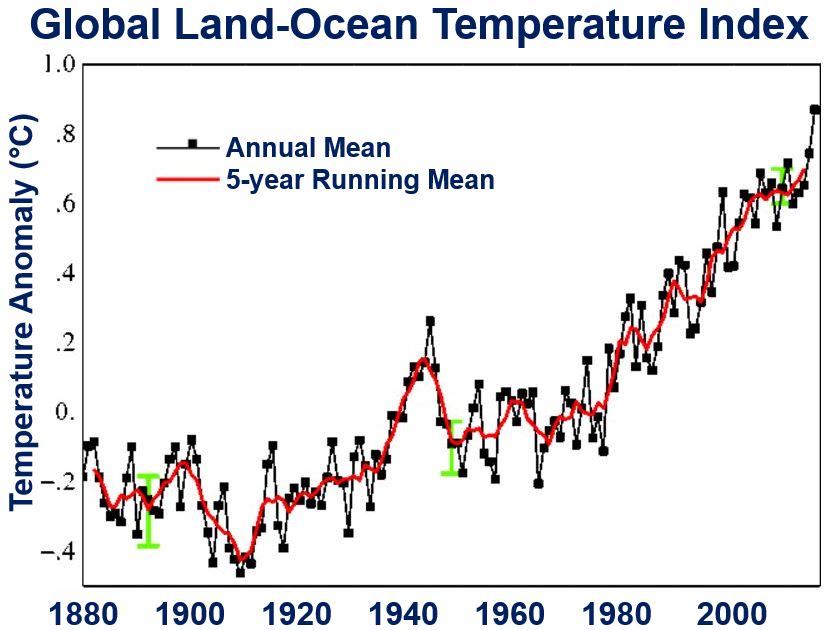
This is the fourth time this century that a global temperature record for the year has been set. Temperatures in 2015 were 0.16°C (0.29°F) higher than in 2014.
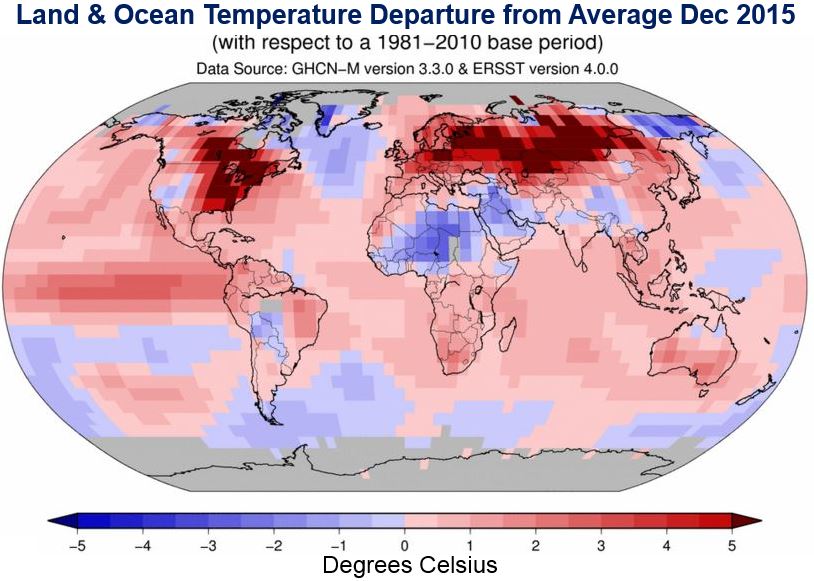
 The pink to dark red colours represent areas that were warmer than the average. (Image: ncdc.noaa.gov)
NASA Administrator Charles Bolden said:
“Climate change is the challenge of our generation, and NASA’s vital work on this important issue affects every person on Earth. Today’s announcement not only underscores how critical NASA’s Earth observation program is, it is a key data point that should make policy makers stand up and take notice – now is the time to act on climate.”
Record broken by widest margin yet
The annual reports adds that 2015 broke the record by the widest margin so far. Ten of the twelve months last year registered record high temperatures, five of them by the widest margins ever.
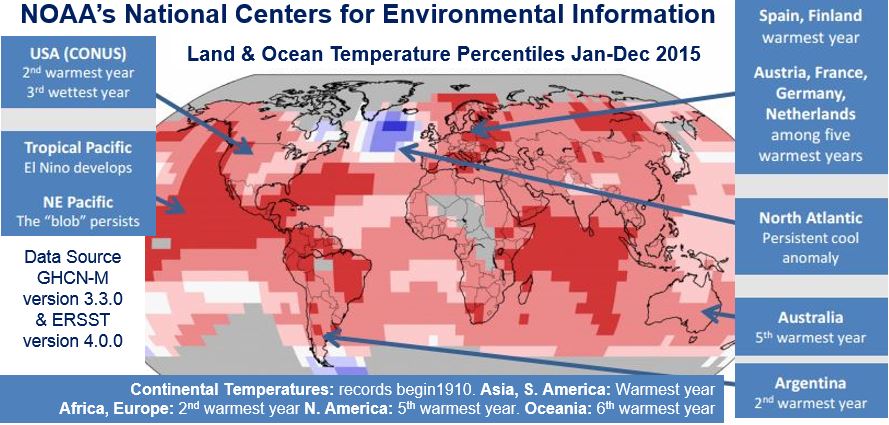
Record warmth was fairly evenly spread across the world, including the northern half of South American, Central America, parts of eastern, southern and northern, Europe, western Asia, a large region of east central Siberia, regions of southern and eastern Africa, most of the Indian Ocean, parts of the Arctic Ocean, and a large band through the western north Atlantic.
The globally-averaged land surface temperature was 1.33°C (2.39°F) higher than the average during the 20th Century. This is the largest margin by which the yearly worldwide land temperature has been broken.
The globally-averaged sea surface temperature was 0.74°C (1.33°F) above the average in the 20th Century.
Different parts of the Earth’s atmosphere
Lower Troposphere: the lowest five miles. 2015 was the third warmest in the 1979-2015 record, at 0.36°C (0.65°F) higher than the 1981-2010 average, according to analysis by the University of Alabama Huntsville (UAH). It was the third warmest on record, at 0.26°C (0.47°F) higher than the 1981-2010 average.
 Zero temperature is the base period 1951-1980. The dotted black line is the annual mean and the solid red line is the 5-year mean. The green bars show uncertainty estimates. (Image: data.giss.nasa.gov)
Mid-Troposphere: from 2 to 6 miles above the Earth’s surface. 2015 was the third warmest in the 1979-2015 record, at 0.27°C (0.49°F) higher than the 1981-2010 average, and the fourth warmest on record, above the 1981-2010 average.
Lower Stratosphere: 10 to 13 miles above Earth’s surface. 2015 was the 13th lowest in the 1979-2015 record, at 0.31°C (0.56°F) lower than the 1981-2010 average, as analyzed by UAH and 14th lowest according to RSS (Remote Sensing Systems).
On average, the stratospheric temperature is falling while the lower and middle troposphere temperatures are rising, as one would expect in a greenhouse-warmed world.
 Only the North Atlantic registered a cool anomaly, the rest of the world was warmer last year. (Image: nasa.gov)
Remarkable despite El Niño effect
Phenomena such as El Niño or La Niña, which heat up or cool down the tropical Pacific Ocean, can contribute to short-term fluctuations in global average temperature. For most of 2015, a global El Niño was in effect.
Gavin Schmidt, Director of NASA’s Goddard Institute for Space Studies (GISS), said:
“2015 was remarkable even in the context of the ongoing El Niño. Last year’s temperatures had an assist from El Niño, but it is the cumulative effect of the long-term trend that has resulted in the record warming that we are seeing.”
Video – Earth’s Long-Term Warming Trend 1880-2015
This NASA video contains a visualization that illustrates Earth’s long-term warming trend, showing temperature changes from 1880 to 2015 as a rolling five-year average. Orange colours represent warmer than the 1951-80 baseline average, while blues represent cooler temperatures than the baseline.
