
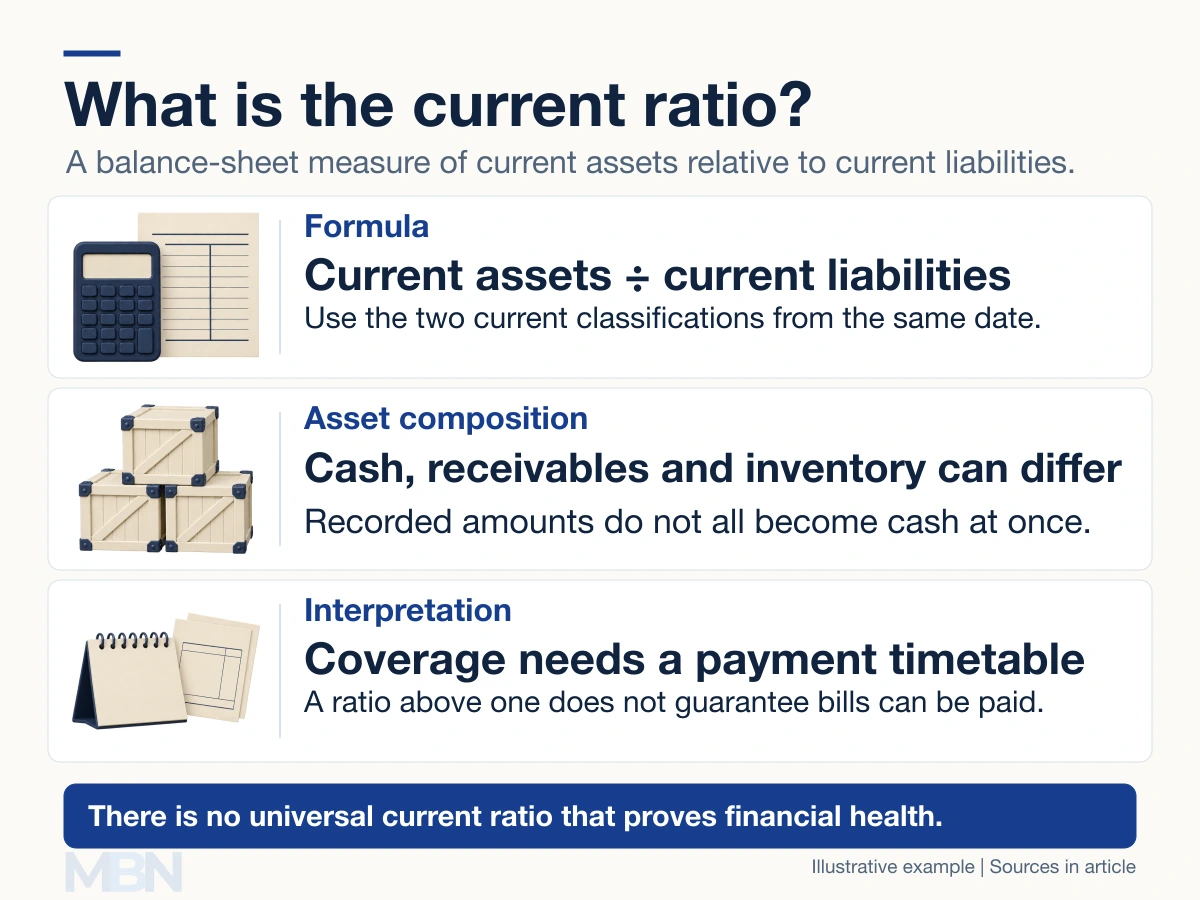
The current ratio compares a company’s current assets with its current liabilities. It is a short-term liquidity indicator, calculated from a balance-sheet date, rather than proof that every upcoming payment can be made.
The formula is current assets ÷ current liabilities. Using total assets, including long-lived property and equipment, would answer a different question.
What does “current” include?
Current assets commonly include cash, receivables, inventory and qualifying prepayments. A prepayment represents a benefit already paid for, rather than cash waiting to be collected.
The classification is not always limited to twelve months. The IFRS Interpretations Committee’s operating-cycle clarification addresses inventory classification. Assets sold or consumed within a normal operating cycle can be current even when that cycle lasts longer than a year.
Current liabilities commonly include trade payables, accrued expenses and borrowing amounts classified as current. The applicable reporting framework and rights at the reporting date determine the classification.
A checked calculation
Suppose a fictional company has $200 million of current assets and $160 million of current liabilities. The current ratio is $200 million ÷ $160 million = 1.25. It has $1.25 of recorded current assets for each $1 of current liabilities.
Now divide the assets into $20 million cash, $100 million receivables and $80 million inventory. Assume no short-term investments or prepayments.
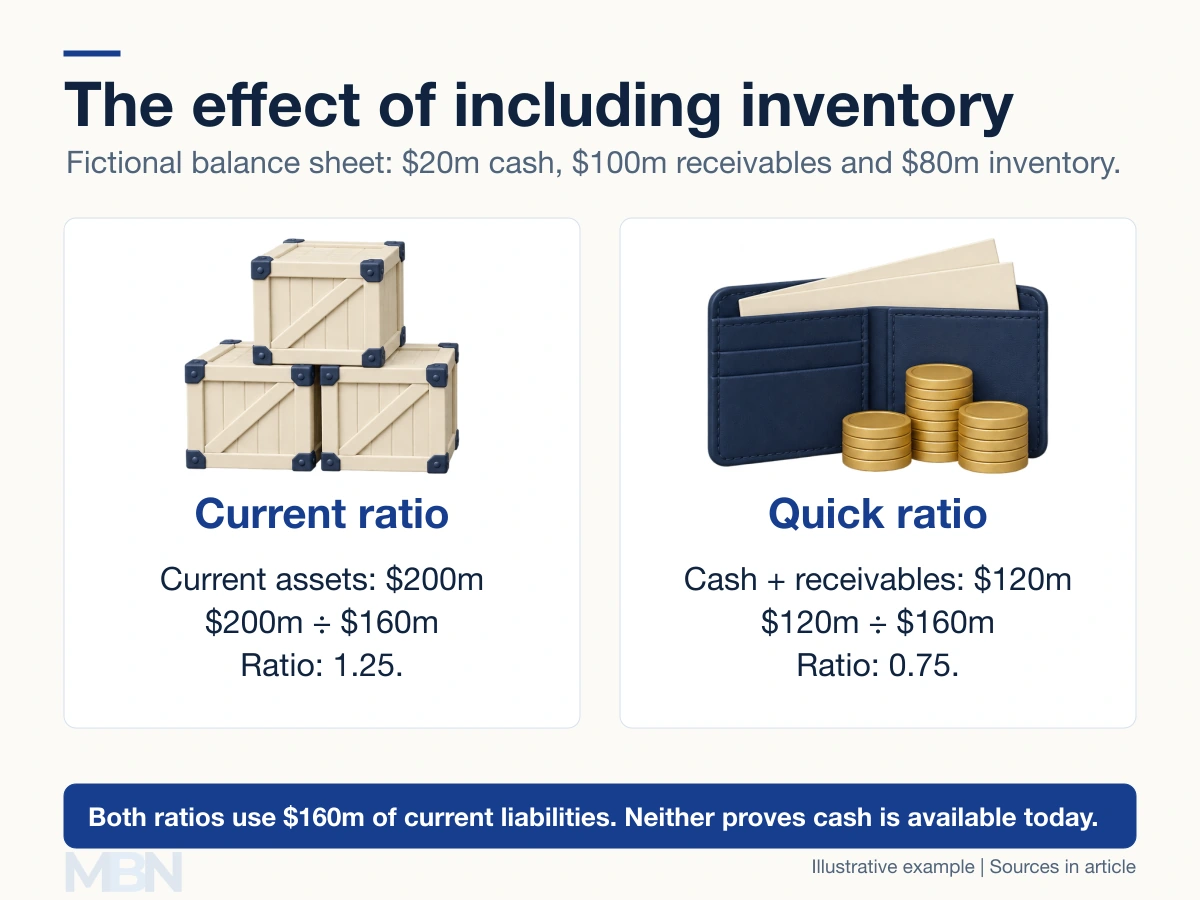
CFA Institute’s quick-ratio formula uses cash, short-term investments and receivables. Here those assets total $120 million, giving $120 million ÷ $160 million = 0.75. Inventory explains the difference from the 1.25 current ratio.
Why a ratio above one is not a guarantee
Only $20 million in the example is cash. Customers may pay later than the company’s own bills, and inventory may take time to sell or realize less than its recorded value.
Conversely, a business with a ratio below one might receive cash from customers before its supplier payments fall due. The ratio alone cannot establish either safety or insolvency.
CFA Institute stresses the need to interpret ratios together and in context. Industry patterns, seasonality, cash-flow forecasts, funding availability and trends help explain a figure. There is no universally healthy range of 1.5 to 3.
Why changes in the ratio need explanation
Buying inventory with cash generally changes the composition of current assets, not their total, before other effects. Producing more stock therefore does not automatically create liquidity.
Long-term borrowing can increase cash and the current ratio while also adding future repayment obligations. A higher number may reflect financing or slower-moving inventory, rather than an improvement in trading performance.
Last checked and updated on November 3, 2026 by the MBN editorial team.