
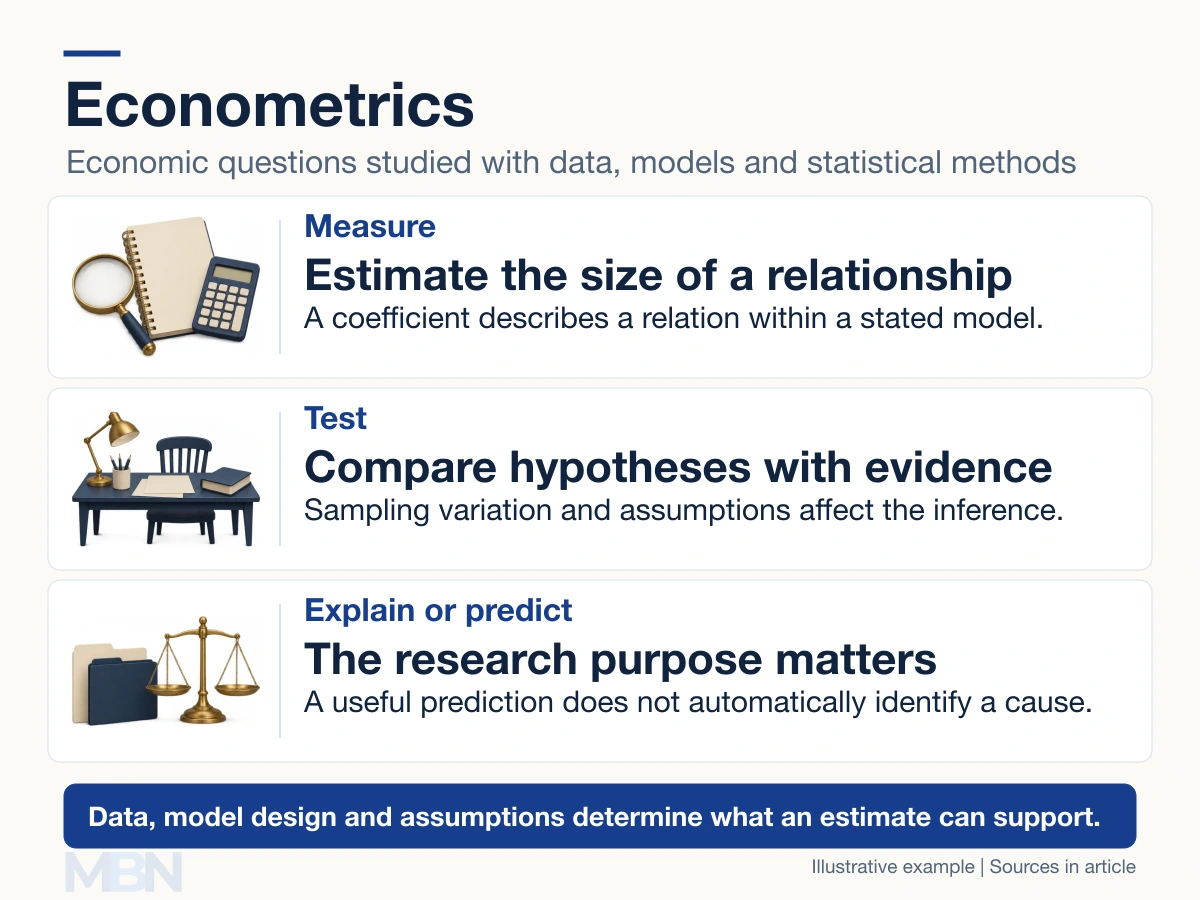
Econometrics combines economic reasoning with data and statistical methods to estimate relationships, test hypotheses and make predictions. Establishing cause and effect is a further task that requires a credible research design.
It can address questions such as how spending varies with income, how a policy changes employment or how well a model forecasts demand. A numerical answer is useful only when its units, assumptions and uncertainty are understood.
From a question to an estimated relationship
The IMF’s introduction to econometrics describes how economic theory and statistical inference are used together. Theory helps specify a relationship; data provide evidence with which to estimate and assess it.
Researchers define an outcome, possible explanatory factors and a relevant population and period. Cross-sectional data compare units at a point in time, time-series data follow a measure through time, and panel data follow multiple units over time.
Regression is one common method for estimating how an outcome varies with explanatory factors. Its coefficients depend on the variables, units and mathematical form chosen. A number is not a universal economic law simply because software estimated it.
A simple coefficient example
Suppose an illustrative model is: predicted monthly household spending = $100 + 0.80 × monthly disposable income. Disposable income means income after applicable personal taxes, not money left after paying all bills.
At income of $1,000, predicted spending is $900. At $1,200, it is $1,060. The $200 difference in income corresponds to $160 in predicted spending. The coefficient 0.80 means 80 cents of predicted spending per additional dollar of income within this model.
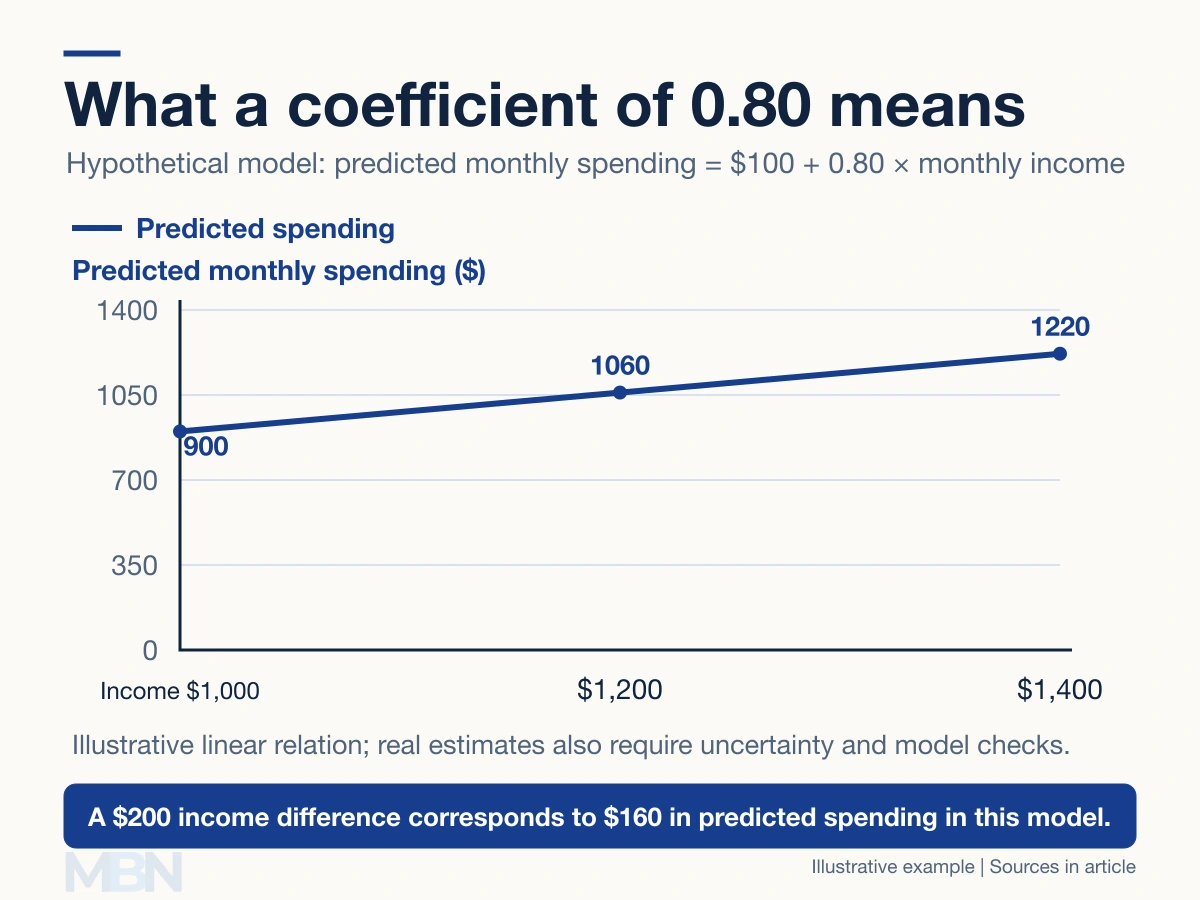
Actual spending may differ from a prediction. The observed value minus its fitted value is a residual. In real research, coefficients are estimated from a sample and reported with measures of uncertainty, rather than treated as known exact values.
Association does not establish causation
Higher income and higher spending can occur together without a simple regression isolating the effect of extra income. Wealth, family size or other factors may affect spending and be related to income. MIT’s material on omitted-variable bias explains this identification problem.
Reverse causation and measurement errors can also distort interpretations. Adding many variables is not an automatic solution: controls need a justification related to the causal question.
Experiments, natural experiments, instrumental variables and other designs can help under their respective assumptions. The 2021 economics prize explanation shows why interpreting causal relationships requires more than finding a correlation.
Testing, forecasting and limitations
Hypothesis tests assess how compatible data are with a specified statistical claim under a model. Statistical significance does not by itself show that an effect is large, useful or causal.
A model that fits historical data closely can still forecast poorly. Forecasts need evaluation on data not used to fit the model, and relationships can change when policies or economic conditions change.
Theoretical econometrics develops and studies methods; applied econometrics uses and evaluates them on substantive questions. Data problems feed back into method development. Variance describes dispersion around a mean; changing error variance is a statistical issue, not proof that the underlying data have become invalid.
Ragnar Frisch and Jan Tinbergen were pioneers of the field. Tinbergen’s 1969 prize lecture discusses the relationship between models, shocks and the economy. Their work was part of a broader development of quantitative economic analysis.
Last checked and updated on November 10, 2026 by the MBN editorial team.