Economic Indicators are statistics about a country’s economic activity. They allow analysts and policymakers to judge the overall health of the economy. Policymakers are people who make decisions about a country’s economic, political, and social affairs.
A wide range of people, from government officials to everyday investors, monitor these indicators to understand where the economy has been, currently is, and where it is heading.
Some of them may be complex, but understanding the basics is crucial for anybody who is looking to grasp the broader economic picture.
The Cambridge Dictionary has the following definition of the term “Economic Indicator”:
“Information that shows how well or badly an economy is doing.”
Types of economic indicators
Indicators may be leading, lagging, or coincident.
- Leading
Leading indicators are forward-looking, they help us predict future economic activity. Stock market returns, consumer sentiment surveys, and the number of building permits issued, for example, give us a glimpse of what may happen in the economy soon.
- Lagging
Lagging indicators are backward-looking, that is, they look at the past. They only change after the economy as a whole does. This type of indicator is useful for confirming trends.
Unemployment and interest rates are lagging indicators, they reflect the economy’s past actions and outcomes.
- Coincident
Coincident indicators tell us what is happening now – they move with the economy in real-time. This type of economic indicator provides information about the economy’s current state.
Examples of coincident indicators are retail sales, industrial production figures, and gross domestic product (GDP).
Economic indicators are valuable tools
For anybody who is looking to understand the health of an economy, these indicators are valuable tools. They can signal when an economy is expanding, contracting, or heading either way. They can also tell us how consumer behavior is shifting.
All the information they convey helps us make informed business, investment, or policy decisions.
Economic indicators don’t tell us everything
Remember, however, that no single indicator can give us a complete picture of the economy’s health. Each one only gives us a “slice of the pie.”
Analysts, economists, and policymakers and their advisors look at a range of data to make more accurate predictions.
Most indicators are subject to revisions. What you read today, may be revised or adjusted after a few weeks or months.
Some economic indicators
Here are some of the most popular and important indicators, along with a brief description and an example sentence of each:
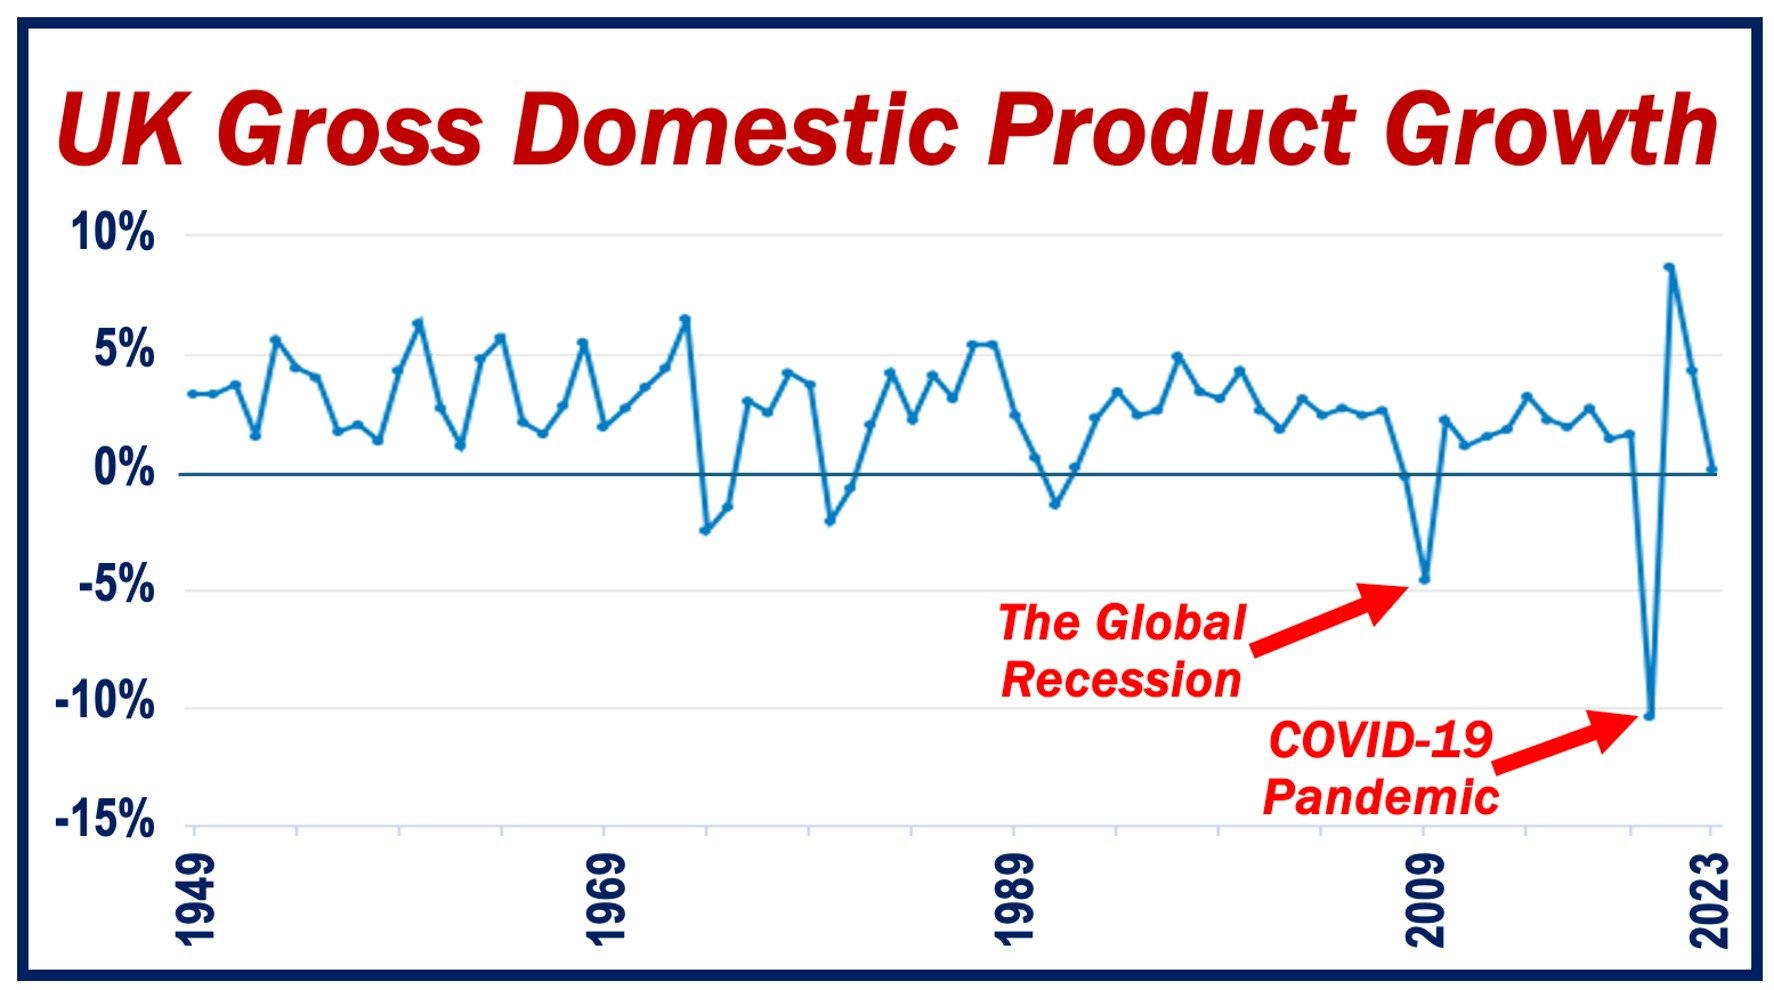
Measures the total value of all goods and services produced over a specific time period within a country’s borders. It’s the broadest indicator of economic output and health.
Example: The GDP of the country grew by 2.5% last quarter, indicating a strengthening economy.
-
Unemployment Rate
The percentage of the labor force that is jobless and actively seeking employment.
Example: The unemployment rate dropped to 4.7%, signaling an improvement in job market conditions.
-
Consumer Price Index (CPI)
Measures the average change over time in the prices paid by urban consumers for a market basket of consumer goods and services.
Example: A CPI increase of 0.4% last month suggests rising inflation pressures.
-
Producer Price Index (PPI)
Measures the average change over time in the selling prices received by domestic producers for their output.
Example: A sharp rise in the PPI indicates that producers are facing higher costs, which may be passed on to consumers.
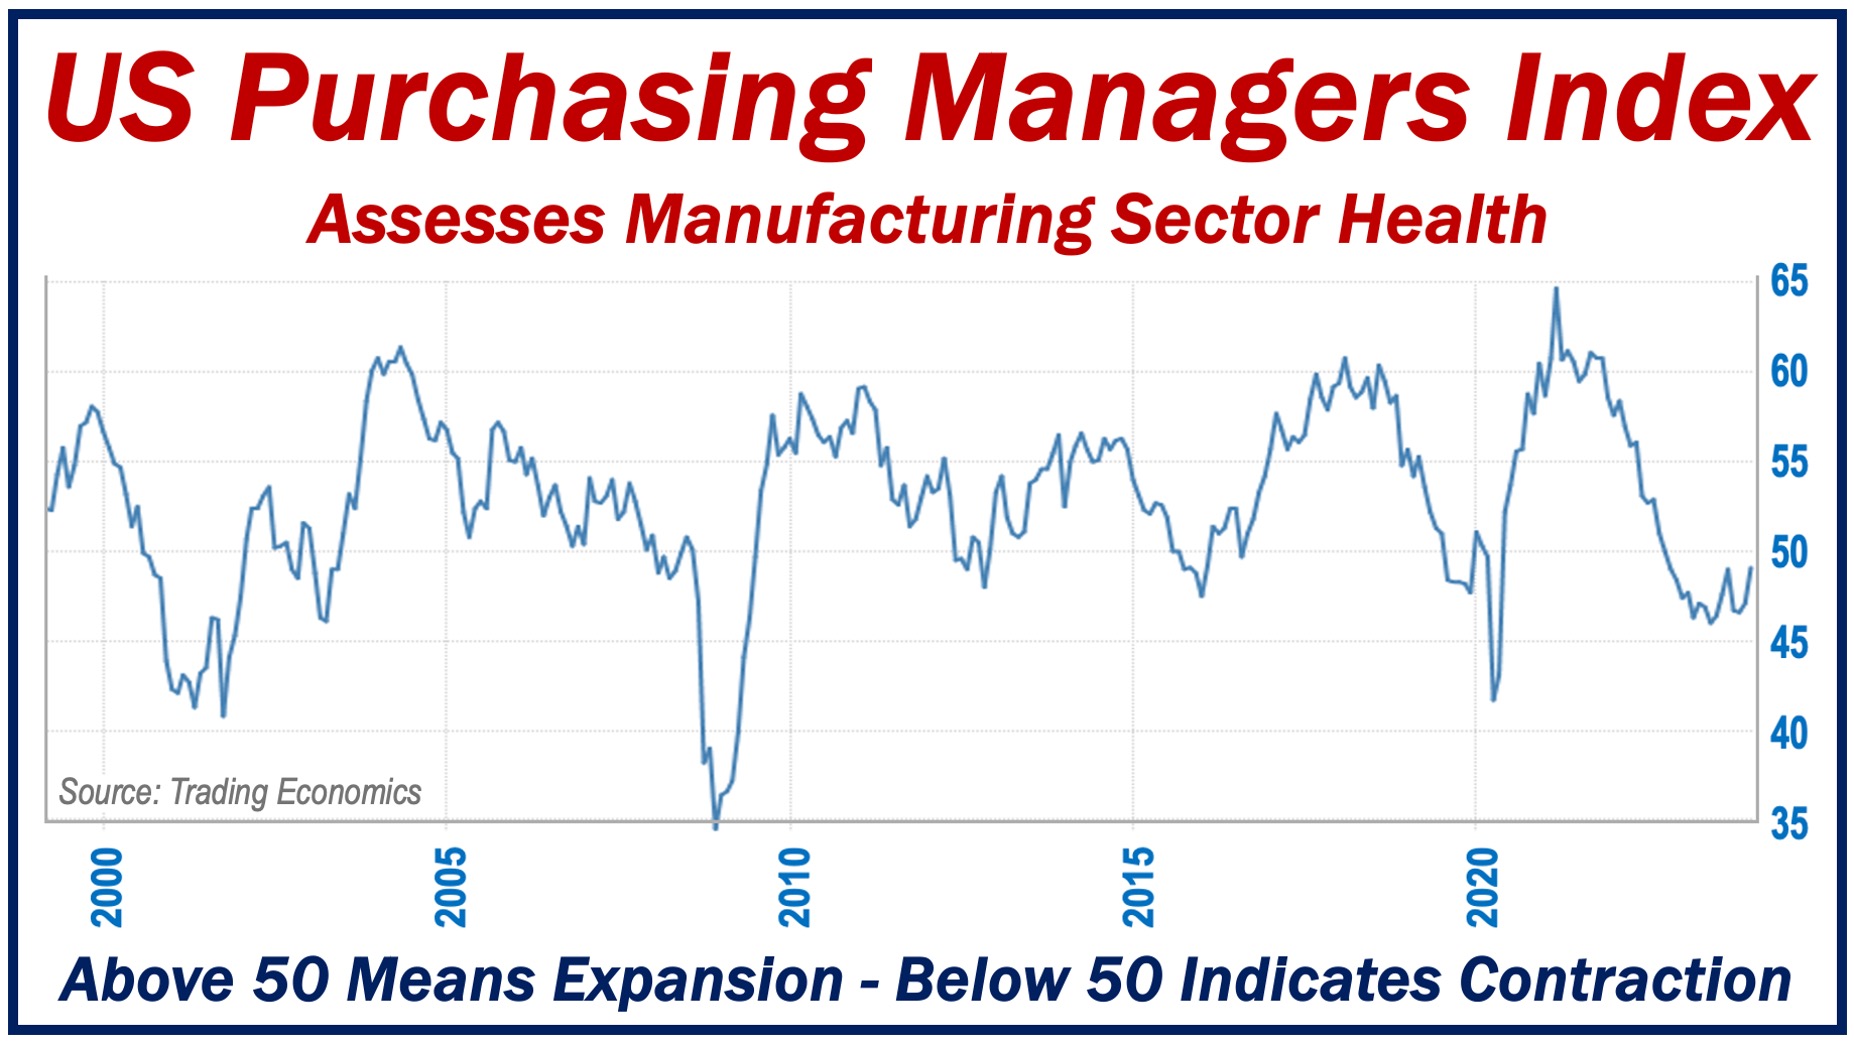
Assesses manufacturing sector health through new orders, inventory, production, supplier deliveries, and employment. PMI above 50 means expansion; below 50 indicates contraction.
Example: The PMI jumped to 54.2 this month, indicating a robust expansion in the manufacturing sector and a positive outlook for the economy.
-
Retail Sales
Measures the total receipts at stores that sell merchandise to the public. It’s a primary gauge of consumer spending.
Example: Retail sales rose by 1.2% in March, pointing to robust consumer confidence.
-
Consumer Confidence Index (CCI)
Reflects the degree of optimism that consumers feel about the overall state of the economy and their personal financial situation.
Example: The consumer confidence index soared to 95 this month, suggesting people are more willing to spend.
-
Housing Starts
The number of new residential construction projects that have begun during any particular month.
Example: An increase in housing starts last quarter indicates a booming real estate market.
-
Industrial Production
Measures the output of the industrial sector, including manufacturing, mining, and utilities.
Example: Industrial production rose by 0.3%, signaling strengthening industrial activity.
-
Federal Funds Rate
The interest rate at which depository institutions trade federal funds (balances held at Federal Reserve Banks) with each other overnight.
Example: The Federal Reserve decided to raise the federal funds rate by 25 basis points to combat inflation.
-
Balance of Trade
The difference between a country’s imports and exports of goods and services.
Example: A widening trade deficit suggests that the country is importing more than it is exporting.
Conclusion
Economic indicators are vital tools for assessing the current, past, and possible/potential future of the economy. They help us make informed decisions about future trends and understand past and current conditions.
Whether you are a policymaker, investor, journalist, or simply someone interested in the economy, monitoring these indicators can provide valuable insights.