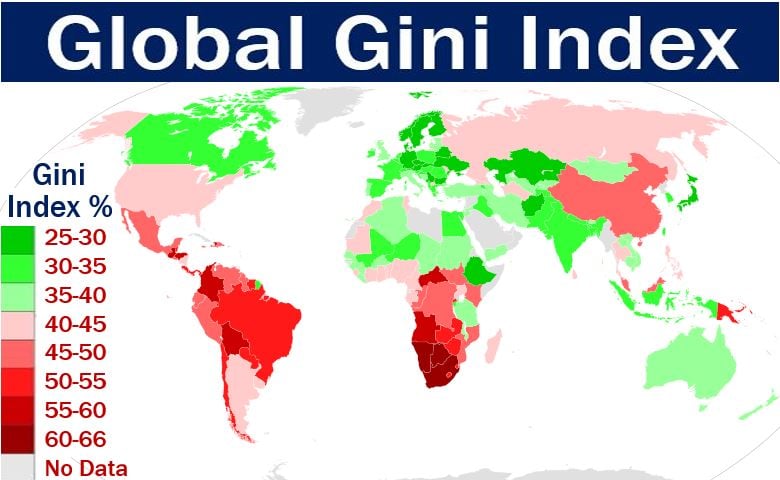
The Gini Index or Gini Coefficient is a way of comparing income equality between countries. It is a standard economic measure of a country’s income distribution which is based on the Lorenz Curve. Less commonly, people also use it to measure wealth or consumption expenditure distribution.
Income distribution looks at the equality or inequality of how much people earn. Wealth distribution, on the other hand, looks at the equality or inequality of how much people have.
The Gini Index ranges from 0% to 100% or 0 to 1. In a country with a coefficient of zero percent or zero, everybody is the same, i.e., all incomes are equal. In a nation with a coefficient of 1 or 100%, one person earns all the income.
Clearly, no country with a Gini Index of 0 or 1 exists; they are all somewhere in between.
Gorrado Gini (1884-1965), an Italian statistician and sociologist, developed the Gini Index in 1912. He explained the coefficient in his paper Variabilità e mutabilità (Variability and Mutability).
Gini built on the work of Max O. Lorenz (1876-1959), an American economist who developed the Lorenz curve. Lorenz developed the curve – a straight diagonal line – in 1905 to describe income equality.

Gini Index versus nation’s wealth
The Gini Index is a popular and effective tool for analyzing wealth or income distribution within a region or country. We use it more for measuring income than wealth distribution because wealth distribution is harder to calculate.
However, we do not use the Index to measure absolute wealth or income.
Two countries may have the same Gini Coefficient, but one is an advanced economy while the other is an emerging economy. In other words, two countries, one with a high GDP per capita and the other with a low GDP per capita, may have the same Index.
GDP per capita, i.e., GDP divided by the population, tells us how rich a country is. The Gini Index does not. GDP stands for Gross Domestic Product.

Gini Index is not perfect
The Gini Index is technically sound if you wish to measure income inequality across a whole country or region.
However, statisticians and economists say that it is not sensitive enough to changes in the income extremes. It is also oversensitive to changes in the middle.
The BBC Magazine Monitor quotes Andy Sumner, director of the International Development Institute at Kings College London, who said:
“The Gini has been around for a very long time, and it’s very technically sound if you want to measure income inequality across the whole population.”
“But one might say the Gini is oversensitive to changes in the middle, and undersensitive at the extremes.”
The Gini Index does not capture changes in the top 10% income bracket very explicitly. This is unfortunate because that is where much of the focus on inequality today is.
It does not capture the bottom 40% very explicitly either. Most of a country’s poverty, in fact, lies in the forty percent.
