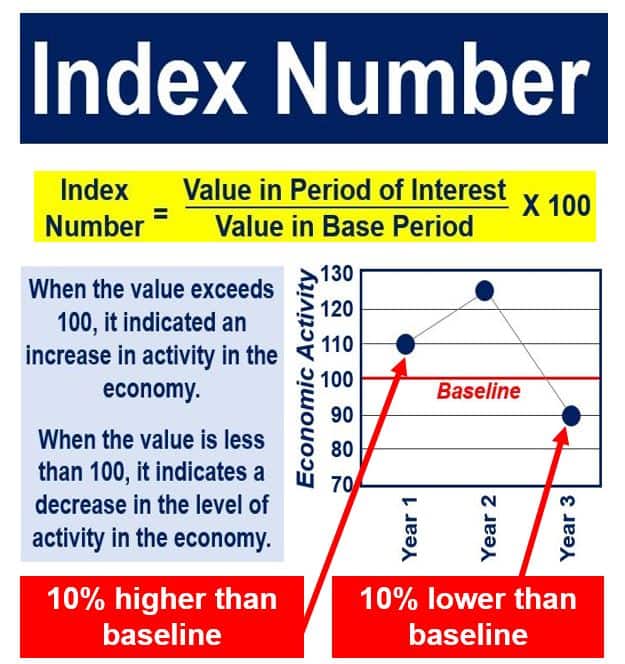
An index number is an economic data figure that reflects quantity or price compared with a base or standard value. The base is usually 100, and refers either to a date, a specified price, a level of production, etc. Economists spend much of their time crunching numbers and compiling indices of individual data, so that they can analyze different components and aspects of the economies and populations of the world. The plural of index is indices.
Inflation, for example is measured by an index of retail (consumer) prices. Index numbers exist for literally thousands of things that are purchased and sold, of which maybe the best known are the share price indices such as the FTSE-100 and the Dow Jones Industrial Average.
Put simply, an index number is a way to show how things change over time using a simple point of reference. Basically, one number (called the base) is set to 100, and then all the other numbers are compared to it.
This helps show the average percentage change in things like prices, wages, or production. It’s a handy tool for spotting trends and seeing how much something has gone up or down compared to the starting point.

Index numbers are created to study the change in effects of factors that cannot be measured directly.
For example, we are not able to directly measure changes in a country’s business activity. However, we can study relative changes in business activity by examining the variations in the values of some of the factors that influence business activity, and which can be measured directly.
In the world of business, are two main types of index numbers:
– Price Index Number: this measures the relative changes in prices between two specific points in time.
– Quantity Index Number: considered to measure changes in the physical quantity of goods produced, purchased or sold of one item or group of items.

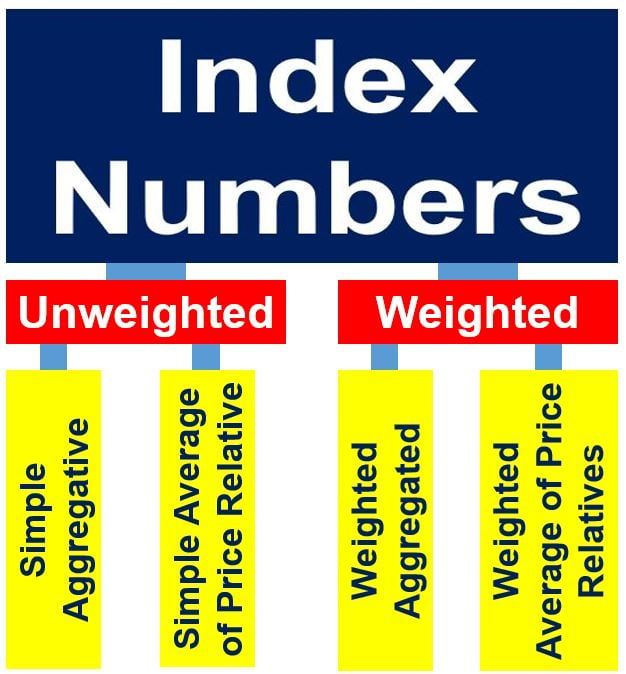
When an index number is ‘weighted’, it means it is given a weight that is relative to its importance. So, in a calculation, one item is given more or less weight (more/fewer points) than another.
Keeping the index number relevant
One of the main difficulties when compiling an index is to determine what exactly to include in it, and what weight to give each thing. Then there is the challenge of preventing that index from becoming obsolete – how to change it over time.
Even the index numbers related to inflation need to be monitored regularly. Inflation measures are based on the price of a basket of goods that the typical consumer buys. Over time, the choice and quality of products in the basket change – the inflation index must take this into account. Economists spend a long time discussing and debating how to accurately apply these changes.
In economics, most index numbers are time series that summarize movements in a group of related variables. Sometimes, as in charts comparing countries’ purchasing power parities, they may compare geographic areas at a specific point in time.
The Consumer Price Index (CPI) is probably the best-known index number. The CPI measures the changes in retail prices to consumers. COLI (cost-of-living index) is an index that measures relative cost of living over specific time spans.
The index number problem
The difficulty in creating a valid index when both quantity and price change over time is known as the ‘index number problem’.
For example, when we construct price indices for inflation, the prices of goods in the economy as well as their nature change over time.
Our 1950 basked of goods did not have the same items as a basked in the year 2016. Sixty-six years ago, the UK’s basket included wild rabbits, corsets, and candles, items people no longer regularly purchase.
Today, items such as online subscriptions, computer games, health club/gym membership, and mobile phone expenses are included in the basket. Not only did people in the 1950s not buy those items, they had no idea what smartphones, computer games or the Internet were.
Apart of the difference in the range of items in the basket of goods in 1950 and 2016, many of the same ones have changed in quality.
This is no theoretical magic formula that solves this problem. The basket of goods is updated every few years to reflect changes. Despite the meticulous care taken by their creators, several economic indices taken over long periods are not exactly like-for-like comparisons.
When researchers in economic history are gathering, analyzing and comparing data, it is something they need to take into account.
In a report written by Carol McDonnell, Jim O’Donoghue and Martin Placek, from the UK’s Office for National Statistics, they wrote:
“Comparisons of trends in expenditure weights are not always straightforward because of changes in the way in which the goods and services have been classified over the years, particularly when comparing the pre-1987 period with the period since then.”
“It is also important to be aware of changes in the coverage of goods and services included in the RPI over the years. Nonetheless, it is possible to discern some clear trends.”
Indexes in business and finance
Investors and traders are forever checking various indexes (indices).
For example, the Major Market Index, consists of twenty-blue chip company stocks, seventeen of which appear in the Dow Jones Industrial Average as well as the New York Stock Exchange. Trading in futures and options is based on this index.
Video – Index Numbers – Definition and Meaning
This video explains what index numbers are used for. They are basically utilized to express percentage changes from a base. The speaker uses UK gross domestic product (GDP) data in his presentation.
