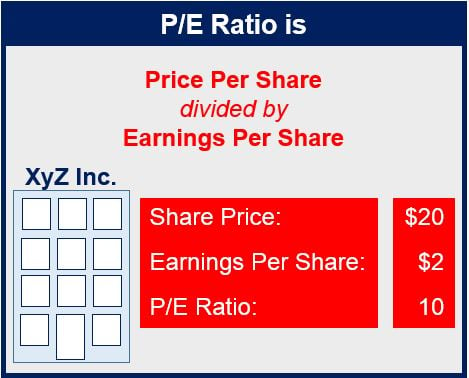
The price-earnings ratio, or P/E ratio, calculates a corporation’s current share price compared to its earnings per-share. It is one of several ratios (financial ratios) people use from data contained within a firm’s financial statement to determine how will it is doing.
A high P/E ratio can be an indicator of high earnings and future growth. A low P/E may suggest the opposite.
The best way to use the P/E ratio is to compare it to the P/E ratios of other companies that target the same market, i.e. those in the same industry.
Comparing the P/E ratios of companies that are in different industries does not provide an accurate picture of how a company is performing, because each industry has its own unique growth potential.
 One should not base a company’s future growth prospects on just its P/E ratio. Accounting measures of earnings are often subject to manipulation.
There are different types of the P/E ratio:
- Trailing P/E – uses net income for the most recent 12 month period, divided by the weighted average number of common shares in issue during the period. This is the most common way of calculating the P/E ratio.
- Trailing P/E from continued operations – uses operating earnings (excluding earnings from discontinued operations and extraordinary items).
- Forward P/E – this uses estimated net earnings for the next year. Estimates are typically determined by an expert group of analysts.
The price-to-earnings ratio formula is:
Market Value per Share / Earnings per Share (EPS)
Example of calculating the price-to-earnings ratio:
Assume a company trades its shares at $30.00 each and earnings over the past year were $2.00 per share. In this case the P/E ratio would be 15 (30.00/2.00).
