Sharpe ratio is a calculation that measures the real return of an investment after adjusting for its riskiness. It is particularly useful when we are comparing at least two investment opportunities, because it levels out market volatility – the returns are flattened as if the risk were eliminated.
The Sharpe ratio can be used as a rough guide to whether an investment’s expected rewards justify the risk.
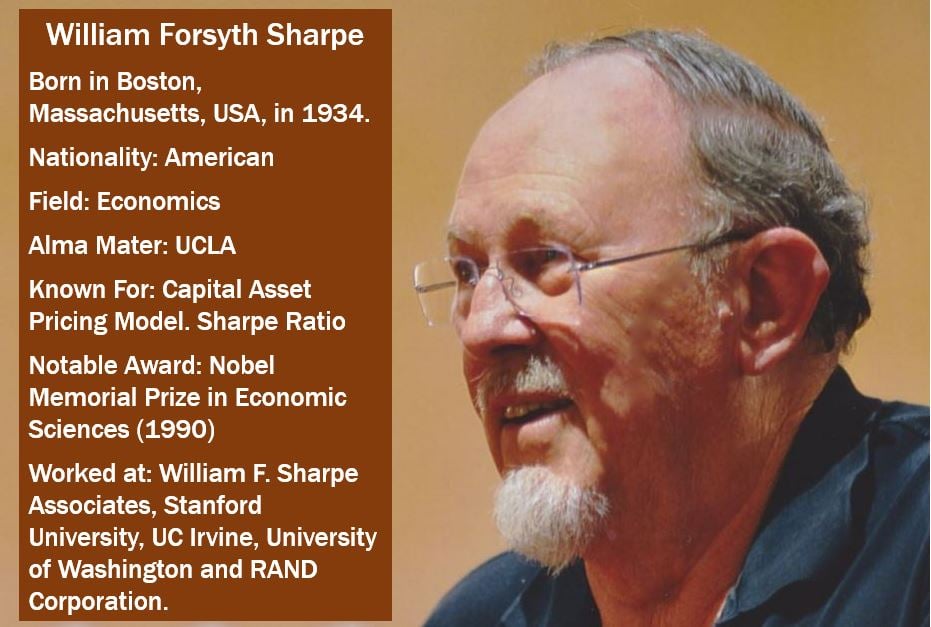
Also known as the reward-to-variability ratio, Sharpe measure, and Sharpe index, the ratio was named after William Forsyth Sharpe, an American economist, the STANCO 25 Professor of Finance, Emeritus at Stanford University’s Graduate School of Business. Prof. Sharpe – one of the originators of the capital asset pricing model – was awarded the Nobel Prize for Economics (Nobel Memorial Prize in Economic Sciences) in 1990.
Since the development of the Sharpe ratio formula, it has become the industry standard calculation as a way of canceling out the risk component when assessing investment opportunities.

How does the Sharpe ratio help?
The Sharpe ratio tells us how well an asset’s return compensates us for the risk we take. When we compare two assets against a common benchmark, the one with the greater Sharpe ratio is estimated to provide us with a better return for the same risk – or the same return with a smaller risk.
Like all mathematical models used by economists and scientists, it is crucial that the data used is correct or reliable.
The data gathered and analyzed from a Pyramid scheme will always provide a high Sharpe ratio – however, that data is false.
When ranking the portfolio of mutual fund managers, Sharpe ratios are commonly used, as are Jensen’s alphas and Treynor ratios.
Calculating the Sharpe ratio
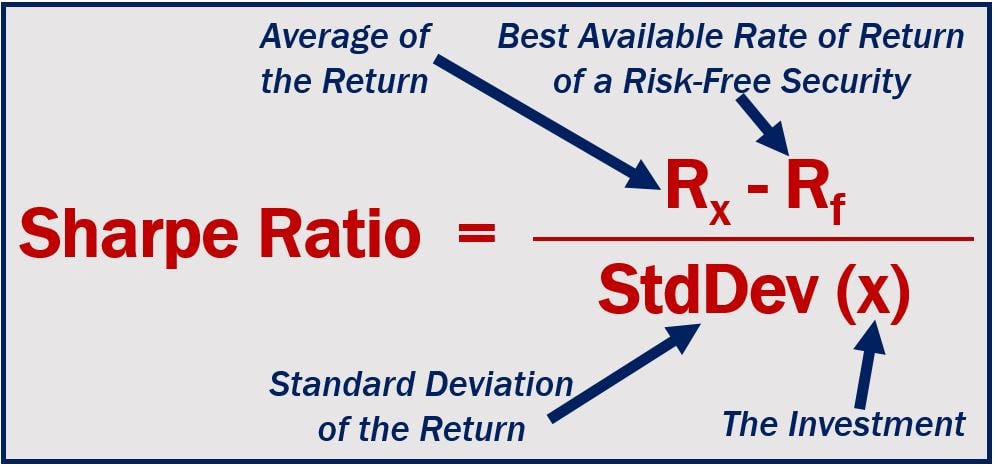
The Sharpe ration is calculated by dividing the difference between and best risk free rate of return available and the average rate of return by the standard deviation of the portfolio’s return. It is not as complicated as it sounds.

Basically, what the Sharpe ratio equation does is to adjust investment portfolios for risk – they are all placed on a level playing field risk-wise – then, all of them can be compared equally.
The Sharpe ratio of art
In a study titled – ‘Does it Pay to Invest in Art? A Selection-Corrected Returns Perspective’ – published in the Review of Financial Studies, Arthur Korteweg, Roman Kräussl and Patrick Verwijmeren found – after gathering and analyzing data on 20,538 works of art (paintings) – that the returns on investment were considerably lower than art dealers had claimed.
The authors found that over the 1971 to 2010 period, the Sharpe Ratio on art was not the 0.24 that investors had been told, but rather just 0.04. Over that same 40-year period, the Sharpe Ratio on equities was 0.30 – considerably higher.
Video – What is the Sharpe Ratio?
This Investor Trading Academy explains what the Sharpe ratio is using simple terms and easy-to-understand examples.
When comparing the performance of at least two securities, portfolios or funds, investors need to consider risk-adjusted returns to determine whether they are being compensated enough for the risk they are taking.
