Weighting is a technique statisticians use so that data better represents whatever it is designed to represent.
One data item, such as an average, is emphasized more than others within a summary or group.
The aim of weighting is to bring whatever is being studied nearer to the average that it is supposed to represent.
For example, if a sample contains 39% females and the general population contains 51% females, weighting may be used to alter the data to correct this divergence.
Weighting is mainly used to compensate for factors that make sample data unrepresentative of whole populations.
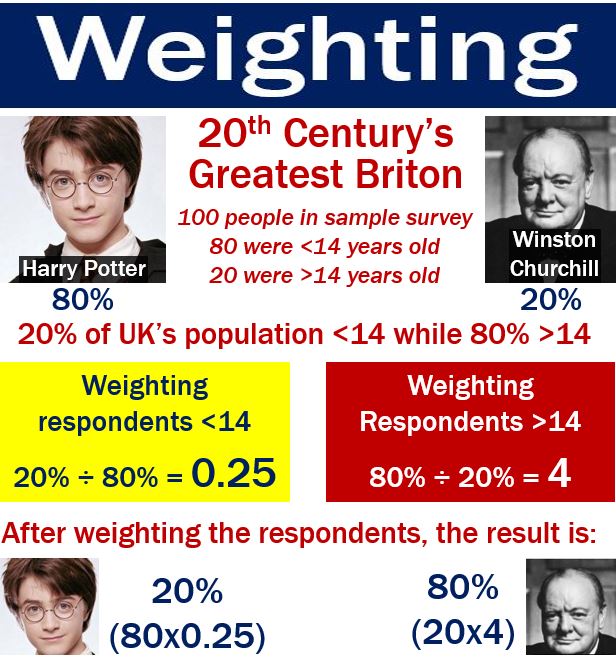
 As you can see in this (extreme) fictitious example, if your sample population is not representative of the country’s population, you need to weight the respondents. If you don’t, the survey is useless.
The aim of survey-type research is typically to make generalizations about the overall population, such as the population of a city, country, or region.
However, in the samples of many surveys, some groups are over-represented due to their design or non-response. If adjustments are not made, the results will be biased or inaccurate.
A major concern in survey research is the potential for estimates to be biased. The majority of social survey datasets include weighted variables.
 In this job advert, ‘London Weighting’ means extra money given to employees because the office is in a part of the country where the cost of living is very high. Even if you live out of town and commute by train, your season ticket will cost several thousand pounds each year.
Weighting – an example
MKTResearch.org was used as a source for some of the information in this fictitious example.
One hundred people were asked who their favorite male actor was. Eighty-percent of respondents picked George Clooney, while 20% chose Arnold Schwarzenegger.
In the sample population, 80% of the respondents were female and 20% were male. This is unrepresentative of the overall population, given that (approx.) 50% are female and 50% are male.
The whole point of carrying out a survey is to draw conclusions about the general population, and not just the sample in the survey. So, in order to work out the weighting that needs to be applied, the survey organizers need to determine how unrepresentative of the general population their sample is.
The survey organizers compute a weight for each respondent in the sample. This is done by dividing the proportion in the real world by the proportion in the sample population.
For example: Fifty percent of the general population is male and 50% is female, while 80% and 20% are male and female respectively in the sample. Therefore, weight for each male is 50% ÷ 20% = 2.5, and for each female is 50% ÷ 80% = 0.625.
(Fifty percent for each gender was used to simplify the mathematics in this example. There are slightly more females than males in the general population.)
Getting a less biased result
Now, lets calculate how popular George Clooney is – in the general population – after weighting the 80 female respondents in the sample:
80 x 0.625 = 50%.
How popular is Arnold Schwarzenegger, after the 20 male respondents in the sample are weighted?
20 x 2.5 = 50%.
After the males and females in the sample population have been weighted, the results have become more accurate or reliable.
Although most surveys have weights, some do not. Perhaps they achieved a representative sample of the whole population.
In a guide titled ‘What is Weighting?’, by UK Data Service, the authors wrote:
“Data producers calculate weights to make the data better represent the population it is designed to represent. A weighting variable assigns a value to each case in the dataset to indicate how much they should be represented in the analysis.”
“Weights can be applied in statistical packages such as SPSS and Stata and can be vital for ensuring that results relate to the population of interest.”
Extra money for expensive areas
The term may also refer to additional money paid to employees because the cost of living in a particular area is higher.
The National Health Service offers a minimum weighting allowance of £4,200 and a maximum of £6,469 for employees working in Inner London.
In summary, weighting is a way to give more importance to certain items when calculating an average or dividing something up.
For example, if you’re splitting money among people who need different amounts, you can use a weighting factor so that those who need more get a bigger share. It helps make sure the result is fair or more accurate based on what matters most.
