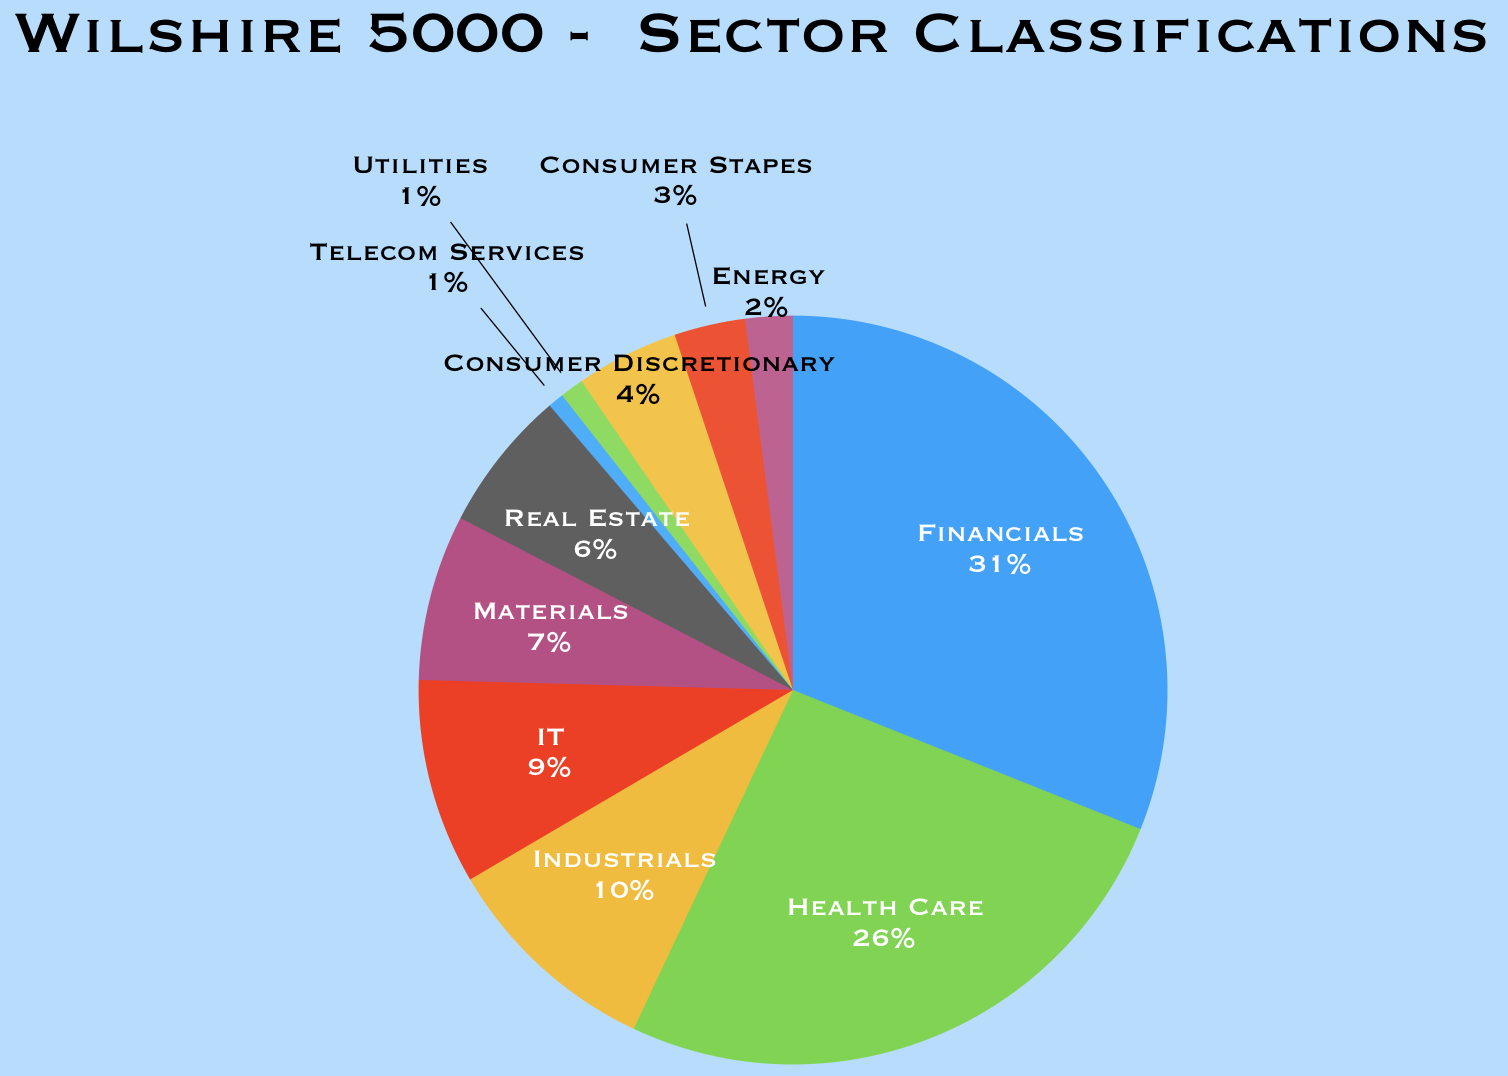
The Wilshire 5000, or Wilshire 5000 Equity Index, also commonly referred to as the Total Stock Market Index, tracks the returns of virtually every stock-market quoted company headquartered in the United States.
Even though it is not as well-known as the American, New York, or NASDAQ stock exchanges, it is by far the largest index by market value globally.
Spelling: The term is spelled without the letter ‘t’, unlike the surname and county in South-West England ‘Wiltshire’ (which has the letter ‘t’).
The Wilshire 5000 does not list any companies headquartered abroad (outside the USA) – it is a measure of US domestic performance only.

According to the US Securities and Exchange Commission:
“The Wilshire 5000 Total Market Index is intended to measure the performance of the entire U.S. stock market. It contains all U.S.-headquartered equity securities with readily available price data. The Index is a capitalization-weighted Index.”
Wilshire 5000 – a definitive benchmark
The Wilshire 5000 is widely accepted by investors, financial journalists, and market experts as the definitive benchmark for the American equity market. It is the first and oldest measure of the country’s total equity market.
When it was launched in 1974, it contained nearly 5,000 stocks, and then grew to a record count of 7,562 in July 1998.
Since 1998, the number of companies listed fell steadily. By December 31st, 2013, there were just 3,776, and 3,818 in September 2014.

Wilshire says that the last time the Wilshire 5000 had over 5,000 companies was on December 29th, 2005.
The Wilshire 5000 base is its capitalization on December 31st, 1980, which totaled $1,404,596 billion. The Index can serve as a good approximation of dollar changes in the American equity market in billions of dollars.
For example, its index value on December 30th, 1985 was 2157.146, compared to 2164.690 on December 31st, 1985 – this represented an increase of approximately $7.5 billion.
Wilshire 500 has three versions:
- Weighted by full capitalization.
- Weighted by float-adjusted market capitalization.
- All securities are weighted equally.
A stock market is a place where company shares are traded. Examples of major stock markets are the New York Stock Exchange (NYSE), the London Stock Exchange Group (LSE), NASDAQ, and the Japan Stock Exchange Group.
A stock exchange or stock market is not the same as a stock index. A stock exchange is a place, while a stock index is a computed average of a sample of share prices. For example, the S&P 500 is a stock index that includes 382 companies from NYSE and 118 from NASDAQ.
