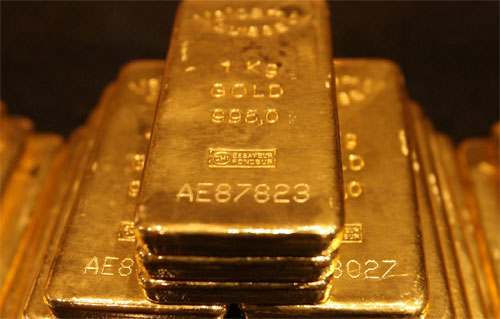
Demand for gold rose 53% in the second quarter of 2013, driven by strong growth in India and China, says the latest World Gold Council Gold Demand Trends report.
The authors of the report explain that recent falls in the price of gold have led to considerable increases in demand.
The biggest markets for gold are in China and India, where growth has been particularly strong recently.
Below are some highlighted data regarding gold demand:
Global jewelry demand
- Increased 37% in the second quarter to 576t (tonnes), from 421t twelve months previously
- Demand in China rose by 54% in a year
- Deman in India went up by 51%
- Significant rises were also reported in the Middle East (33% rise) and Turkey (38%)
Bar and coin investment
- Increased by 78% in the second quarter compared to the same period last year
- Reached 500t for the first time ever
- Demand for gold bars and coins in China rose by 157%
- Demand increased by 116% in India, to a record 122t
Total demand for bar/coin investment plus jewelry combined was 53% higher than during second quarter last year, totalling 1,083t.
Central banks purchased 71t of gold during the second quarter of 2013 – Central banks have been net buyers of gold for ten consecutive quarters.
Demand for gold in the technology sector rose just 1% on the previous year, to 104t.
Gold-backed ETFs (exchange-traded funds) dropped by slightly more than 400t. Hedge funds and other speculative investors have continued to exit their positions, mainly in the USA.
In 2012, gold-backed ETFs accounted for 6% of the total global gold demand.
Gold recycling dropped by 21% in the second quarter of 2013. Gold mine production rose 4% compared to a year ago. Gold supply in total was 6% less in Q2 2013 compared to Q2 2012. (Q2 = second quarter).
Marcus Grubb, Managing Director, Investment at the World Gold Council said:
“The second quarter continued the trend that we saw in the first, of a rebalancing in the market, as gold coming onto the market from ETF sales met with a wave of demand for bars and coins, as well as jewellery. This surge in bar and coin investment was a common theme in key markets around the world, and has been particularly prominent in the world’s biggest gold markets, India and China. This shift from West to East has been further reinforced by recent data from the LBMA showing that in June the volume of gold transferred between accounts held by bullion clearers hit a second consecutive 12-year high, buoyed by strong Asian physical demand.
This quarter again demonstrates the unique diversity of global gold demand, as the self-balancing nature of the market apparent in the previous quarter was even more clearly in evidence. Across the decades, different sectors in the gold market have risen in prominence at different points in the global economic cycle and the current shifts are just part of the normal ebb and flow of what is an extremely liquid market.”
Average gold price for Q2 2013 was $1,415/oz
The average price of gold dropped 12% in Q2 2013 compared to Q2 2012
Gold demand in value terms in Q2 2013 was $39 billion. This is 23% less than during the same period in 2012.
Below are some key findings from the report for Q2 2013:
- Consumer demand in China totaled 276t, an increase of 87% compared to the same quarter in 2012. Consumers are buying cheap gold today because they expect its price to rise. Jewelry demand, at 153t, was 54% higher than the same quarter last year. Bar and coin investment rose by 157% to 123t.
- Consumer demand in India was 71% higher compared to Q2 2012, totaling 310t. Bar and coin investment increased by 116%, while the demand for jewelry went up by 51%. Government measures to slow down demand for gold appear to have had no effect.
- Bar and coin investment increased by 78%, reaching 508t.
- Central banks have demonstrated their commitment to gold. At 71t in Q2 2013, compared to 165t during the same quarter last year, demand has dropped considerably. However, central banks have been net buyers of gold for ten consecutive quarters.
- The net outflow of 402t from ETFs in Q2 2013 was more than offset by inflows from bars and coins and other forms of investment.

