
The Greenland Ice Sheet loss has been colossal since the year 1900 and is accelerating, warns a large international team of scientists, who reported that 9,103 gigatons of ice sheet have vanished. One gigaton is a billion metric tons. This massive ice loss had not been included in the list of contributors for sea level rises in the 20th century.
The scientists, who published their findings in the academic journal Nature, added that from 2003 to 2010 the annual loss of the Greenland ice sheet doubled, compared to the annual average registered throughout the 20th century.
The Centre for GeoGenetics at the Natural History Museum of Denmark, which led the study, pointed out that previous estimates had been based just on computer models, unlike this study, which was also based on data from direct observations, thus providing a much greater level of insight.
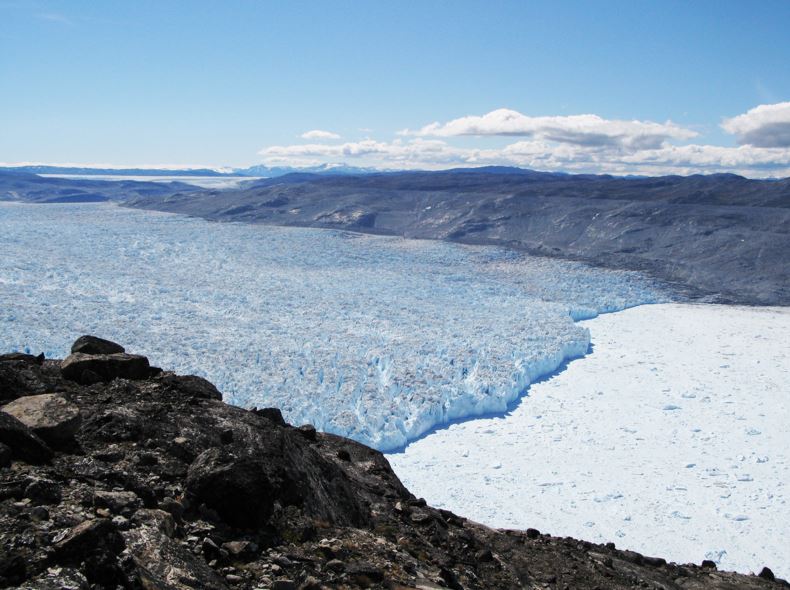 Image of Kangiata Nunata Sermia in Southwest Greenland. It shows different lines that mark the extent of the ice at different points in past time. The upper trimline (transition) between the ligther and darker valley sides marks the extent of the glacier during the Little Ice Age. The lower lines show the extent at later points in time. (Image: geogenetics.ku.dk. Credit: Nicolaj Krog Larsen, Aarhus Universitet).
In this study, the scientists were able to pinpoint where the ice sheet has been particularly sensitive and what controls glacier ice loss in Greenland.
Observation-based study more accurate
According to scientists from the University of Bristol in England, who took part in the study:
“The observation-based results close a gap in the Intergovernmental Panel on Climate Change (IPCC)’s estimate of global sea level budget and should be taken under strong consideration for the next IPCC convention.”
The fluctuating temperatures and what their effect has been on the Greenland Ice Sheet during the last century have long been debated. The controversy has been partly due to the lack of direct observations of the ice sheet across the whole of Greenland before 1992, which has made it virtually impossible to accurately estimate changes both in space and time during the first half of the 20th century.
Consequently, there is no contribution included from the Greenland Ice Sheet to the worldwide sea level budget before 1990 in the IPCC’s 2013 report.
Lead author Dr. Kristian K. Kjeldsen, who works at the Natural History Museum of Denmark’s Centre for GeoGenetics, at the University of Copenhagen said:
“If we do not know the contribution from all the sources that have contributed towards global sea level rise, then it is difficult to predict future global sea levels. In our paper we have used direct observations to specify the mass loss from the Greenland Ice Sheet and thereby highlight its contribution to global sea level rise.”
Glaciers’ imprint on Greenland’s landscape
The science team was particularly interested in how the ice sheet changed after the Little Ice Age, which occurred from about 1200 AD to the end of the 19th century, which marks when the ice sheet was at its thickest during the past one thousand years.
 Image taken from another angle of Kangiata Nunata Sermia in Southwest Greenland. (Image: geogenetics.ku.dk. Credit: Hans Henrik Tholstrup, Natural History Museum of Denmark)
Greenland’s Ice Sheet leaves an imprint on the landscape when it retreats. Researchers look at the landscape to determine what changes there have been.
As the ice advanced, it removed vegetation along the mountain slopes. It also eroded part of the mountain slope, which became lighter in colour, i.e. the non-eroded part where plants are still growing are darker than the eroded parts of mountain slopes.
The ‘trimline’ – the boundary between the lighter and darker parts of a mountain slope – marks the maximum extent of the ice.
Other signals pointing to ice movement may be sediments and rocks, which have been pushed forward by the advancing ice into elongated hills, which like the trimline mark the maximum extent of ice during the Little Ice Age.
Researchers used old aerial photographs
The direct observations that the researchers analyzed were derived from aerial photos. Thousands of photographs were taken in Greenland from 1978 to 1987 – they clearly showed the landforms and trimlines.
Together with current glacier positions, the scientists mapped these features in 3-D in order to reconstruct how much ice sheet there used to be. Since 1983, aerial photos and satellite data provided the basis for similar calculations.
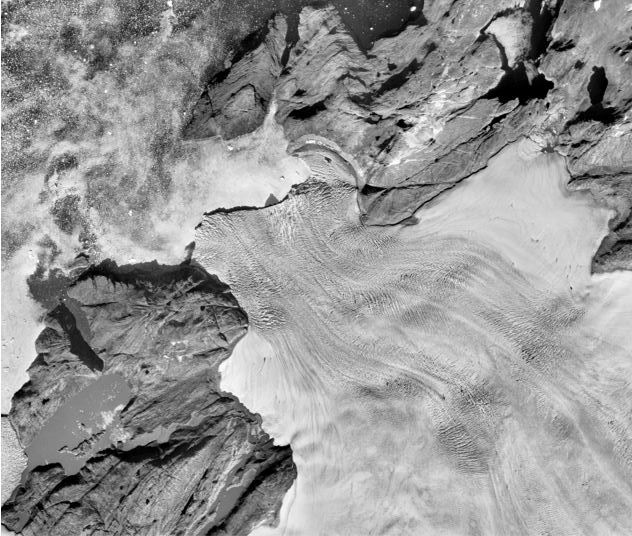 Photo of the Gieseke glacier taken in 1985. Information about the extent of the ice during the Little Ice Age is used to calculate the mass loss of the Greenland Ice Sheet during the 20th. (Image: geogenetics.ku.dk. Credit: Anders Anker Bjørk, Natural History Museum of Denmark).
When merged together, the two methods provided a new technique to map the mass balance and thinning of the glaciers.
The researchers studied three periods carefully: 1900-1983, 1883-2003 and 2003-2010.
Senior author, Professor Kurt H. Kjær, also from the Centre for GeoGenetics, said:
“The foundation for our study is a unique set of aerial photographs recorded by the then Danish National Cadastre and Survey, which cover both the ice-free land and extend up to 100km onto the inland ice itself.”
“The digital reconstruction of the past and present elevation, which is based on the aerial photos, is a first of its kind and allows for the unique surveying of the entire ice sheet and the landscape in front of the ice.”
According to the results, some areas of the Greenland Ice Sheet have lost enormous amounts of ice during the 20th century.
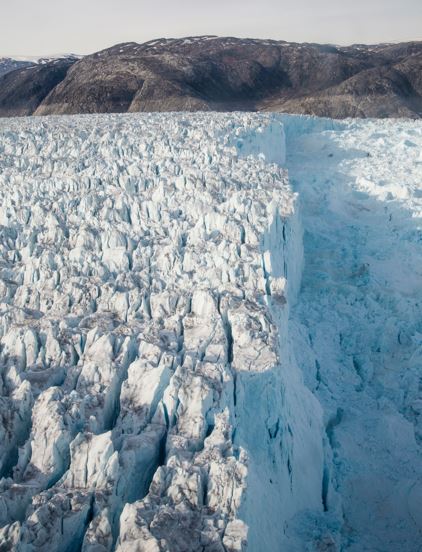 Image of the Helheim Glacier in Southeast Greenland. (Image: geogenetics.ku.dk. Credit: Nicolaj Krog Larsen, Aarhus Universitet)
For the individual periods, the mass loss along the north-western and south-eastern coasts of Greenland contributed from 53% to 83% of all the mass loss.
Dr. Kjeldsen said:
“One of the unique things about our results – which distinguish them from earlier model studies – is that we not only estimate the total mass loss of the entire ice but we can actually calculate changes all the way down to regional and local levels and say something about changes for individual outlet glaciers.”
Greenland mass loss is missing
The Mass loss from the Greenland Ice Sheet from 1900 to 2010, when converted to amount of water, contributed from 10% to 18% to the global sea level rise.
The 2013 IPCC report analyzed changes in global sea levels during the 20th century, as well as individual contributing sources. However, it included no details on contributions from Antarctica and Greenland.
Also, data related to the estimate of sea level rise due to the thermal expansion of sea water is also missing from the 1901-1990 period. This is because previous estimates lacked direct observations.
The authors wrote:
“The new results published in this Nature paper will significantly further our understanding towards global sea level rise during the twentieth century and thus highlight its importance for the next IPCC panel convention to draft a new climate report.”
Professor Kurt H. Kjær explains how this new data will make a significant contribution to future IPCC reports:
“Our paper contributes an estimate mass loss from Greenland for the first part of the twentieth century, which is exactly the period where there is no data in IPCC’s report. As a consequence of this we are one step further in mapping out the individual contributions to global sea level rise. In order to predict future sea level changes and have confidence in the projections, it is essential to understand what happened in the past.”
Citation: “Spatial and temporal distribution of mass loss from the Greenland Ice Sheet since AD 1900,” Kristian K. Kjeldsen, Niels J. Korsgaard, Anders A. Bjørk, Shfaqat A. Khan, Jason E. Box, Svend Funder, Nicolaj K. Larsen, Jonathan L. Bamber, William Colgan, Michiel van den Broeke, Marie-Louise Siggaard-Andersen, Christopher Nuth, Anders Schomacker, Camilla S. Andresen, Eske Willerslev & Kurt H. Kjær. Nature 528, 396–400. December 16, 2015. DOI: 0.1038/nature16183.