Household spending rose during the last quarter of 2016, as Britons dipped into their savings and ran up higher debts, according to the UK’s Office for National Statistics (ONS), the country’s largest independent producer of official statistical data and the recognized national institute of the UK.
The household and NPISH (non-profit institutions serving households) saving ratio is calculated as total consumption expenditure divided by total available resources.
During the last quarter of 2016, the saving ratio declined to 3.3%, the lowest rate ever recorded.
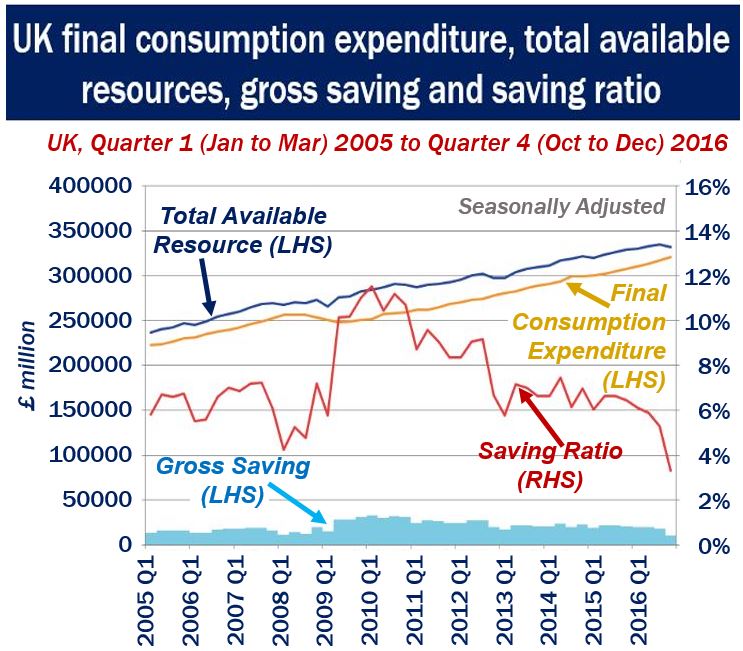 According to the ONS: “1. Total available household resources = gross disposable income plus adjustment for the change in pension entitlements. 2. Saving ratio = gross saving (total resources minus final consumption expenditure) divided by total resources.” (Image: adapted from ons.gov.uk)
Household spending vs. disposable income growth
The ONS says that the saving ratio has been falling since Q3 2015, which mainly reflects greater growth in consumer spending outweighing the growth rate in household disposable income.
Strong consumer spending growth comes on the back of strong labor market activity, while the slowdown in household disposable income growth mainly reflects a decline in other investment income from property income, the ONS informs.
As the image above shows, the saving ratio increased steeply following the global financial crisis – from Q1 2008 to Q2 2009. However, it has been falling steadily since Q3 2015.
According to the ONS:
“The saving ratio can be volatile (as gross saving is a small difference between 2 large numbers – total resources and final consumption expenditure) and is often revised.”
 According to the ONS: “Q1 refers to Quarter 1 (Jan to Mar), Q2 refers to Quarter 2 (Apr to June), Q3 refers to Quarter 3 (July to Sept) and Q4 refers to Quarter 4 (Oct to Dec).” (Image: adapted from ons.gov.uk)
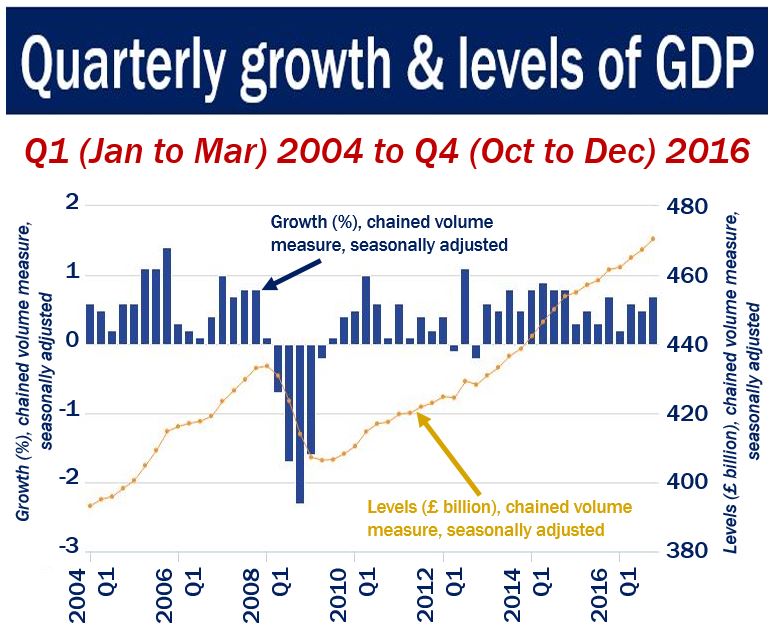
GDP growth Q4 2016
UK GDP (gross domestic product) was estimated to have grown by 0.7% between Q3 and Q4 2016. The last quarter of the year saw a continuation of strong consumer spending and strong output in consumer-focused sectors.
Business investment, however, fell by 0.9% driven by declines in transport equipment and buildings & structures assets “although this is a slightly improved picture from the second estimate of GDP, being revised up by 0.1 percentage points,” the ONS wrote.
UK GDP grew by 1.8% between 2015 and 2016 – this is unrevised from the second GDP estimate.
In volume terms, GDP per head was estimated to have grown by 0.5% between Q3 2016 and Q4 2016.
Video – Official Brexit process hurts pound
On the day the Brexit process is officially launched, the British pound sterling declines.