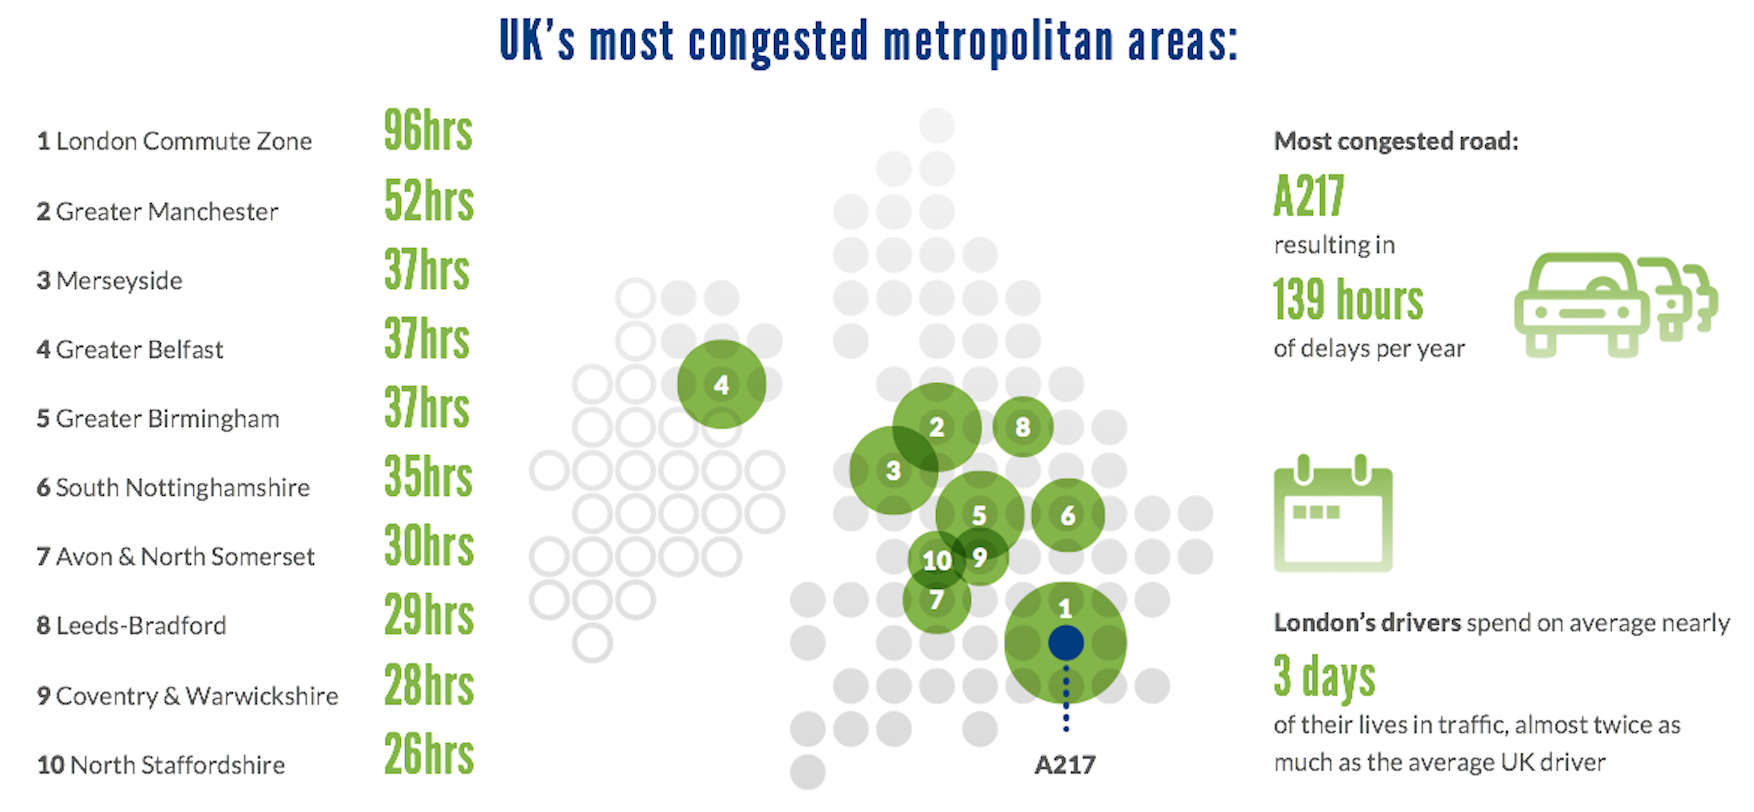
London is Europe’s most congested city, according to the latest INRIX Traffic Scorecard Report. Drivers in the nation’s capital wasted an average of 96 hours stuck in traffic last year.
The top five most congested roads in the UK are all in London, with the A217 and A215 at the top of the list.
The report revealed that drivers in Britain wasted an average of 30 hours in congestion last year, making the UK the fifth most congested country in Europe.
The second most congested city is Manchester, with 52 hours lost to traffic jams, followed by Merseyside, Belfast and Birmingham.
Traffic congestion increased in 14 of 18 UK metropolitan areas last year, versus to 9 in 18 in 2013.

Source: Inrix
The key drivers of traffic congestion are population growth and urbanisation.
“For the third year running, traffic in the UK is up,” said Bryan Mistele, President and CEO, INRIX. “The strong growth of the UK economy and rise in urban populations have resulted in an increase in the demand for road travel, significantly driving levels of congestion up across the country.”
Transport for London’s Chief Operating Officer for Surface Transport Garrett Emmerson, said:
“London’s continued success has made it one of the world’s most popular cities in which to live, work and visit, which also makes it one of the busiest.
“We work hard to keep London’s traffic moving every day, through our state of the art technology, Traffic Control Centre and focus on tackling unnecessary roadworks. We are seeing unprecedented increases in population and this, combined with strong economic growth and the consequent increase in building and construction, creates more traffic. To tackle this, we need continued, sustained investment to boost capacity and modernise London’s road network.
“That’s why we invest every penny of our income in improving the capital’s transport network, including an unprecedented £4 billion pounds over the next few years to transform junctions, bridges, tunnels, cycling lanes and pedestrian areas.”
UK’s ten most congested metropolitan areas in 2014:
| Rank | UK Metropolitan Area | Hours Wasted in 2014 | Change from 2013 (in hours) |
|---|---|---|---|
| 1 | London commute zone | 96 | 14 |
| 2 | Gr. Manchester | 52 | 6 |
| 3 | Merseyside | 37 | -1 |
| 4 | Gr. Belfast | 37 | 6 |
| 5 | Gr. Birmingham | 37 | 3 |
| 6 | S. Nottinghamshire | 35 | -4 |
| 7 | Avon & N. Somerset | 30 | 6 |
| 8 | Leeds-Bradford | 29 | 4 |
| 9 | Coventry & Warwickshire | 28 | 7 |
| 10 | N. Staffordshire | 26 | 7 |
