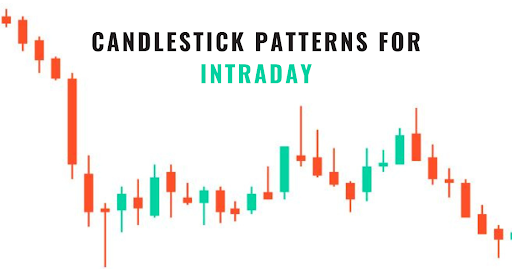
You may become an excellent intraday trader if you can interpret candlesticks and the price movement that goes along with them. With roots in Japan in the 18th century, candlestick charts have been a part of history for many years. Let’s see how to use candlestick charts in this blog.
What is IntradayTrading
Before learning about candlestick patterns, let’s first see what is intraday trading. When traders purchase and sell equities on the same trading day, it is referred to as intraday trading, or “day trading.” There are no open positions at the conclusion of the trading day. Their main business is buying stocks for low prices and selling them at high prices. They also occasionally short-sell shares by buying them at a premium and then selling them the same day for a loss.
dsgWhat are Candlestick Patterns
A Candlestick Pattern shows price fluctuations with straightforward yet effective graphic representations. Every candlestick depicts a different aspect of the tussle between buyers and sellers. The candle’s body length indicates the difference between the opening and closing prices and predicts the winner. The length of the wicks or shadows that hang above and below the body depicts the intensity of the tussle – how buyers raised the price or how sellers brought it down.
Each candle has three parts:
- The Body
- Upper Shadow
- Lower Shadow
A candle has four points of data:
- Open – first trade within the time frame shown by the candle
- High – the highest traded price
- Low – the lowest sold price
- Close – the last price during the period shown by the candle
Different Candlestick Patterns
Candlestick charts are an excellent tool for analysing the mood of investors and the dynamics between supply and demand, bulls and bears.
Remember that a single candle might reveal enough information. Traders can only identify patterns by comparing a single candle with its previous and subsequent candles. Traders must comprehend candlestick chart patterns to take advantage of them.
Types of Candlestick Patterns
There are two types of chart patterns:
- Bullish patterns
- Bearish patterns
For the interpretation of candlestick charts, both patterns are necessary.
Bullish Patterns
The following are some bullish patterns.
Hammer Pattern: This candle has a long lower wick and a short body. It generally lies at the base of a decline. It suggests that robust purchasing drove prices higher despite selling pressure. A green body denotes a more robust bull market than a red body.
Inverted Hammer Pattern: This candle has a long upper wick and a short body. Additionally, it is typically seen near the base of a declining trend. It shows selling pressure coming after purchasing stress. Further, it suggests that purchasers will soon be in charge.
Bullish Engulfing Pattern: In this design, there are two candlesticks. A giant green candle engulfs the first candle and a short red candle. Even if the price opened lower than the day before, it suggests a buoyant market that drives prices higher.
Piercing Line Pattern: This pattern has two candles: a long red candle and a long green candle. The second candle’s closing price must be higher than halfway up the first candle’s body. This suggests significant purchasing pressure.
Morning Star Pattern: One short-bodied candle sits between a long red and a long green candle in this three-candle design. Typically, there is no overlap between the long and short candles. This signifies that a bull market is about to begin and that selling pressure is lessening.
Three White Soldiers Pattern: There are three green candles with tiny wicks in this design of three candles. Above the previous day, these candles open and close. This is a good sign of an impending bull trend following a decline.
Bearish Patterns
The following are some popular bearish patterns.
Hanging Man Pattern: This candle features a short body and a long bottom wick. It generally sits at the peak of an inclining trajectory. It suggests that there was a more significant push towards purchasing than there was towards selling. It also indicates that the market is shifting in favour of the bears.
Shooting Star Pattern: This candle has a small body and a long top wick. It also often sits at the peak of an ascending trend. The market usually opens higher than the day before, rises somewhat, and then crashes like a shooting star. It implies that the market is dominated by selling pressure.
Bearish Engulfing Pattern: This pattern, which appears in candlestick chart analysis, consists of two candlesticks: a massive red candle engulfing a short green candle. Usually, it happens at the peak of an upward trajectory. It suggests a fall and pause in the market’s upward momentum. Generally speaking, the decline is more pronounced if the red candle is smaller.
Evening Star Pattern: One short-bodied candle sits between a long red and a long green candle in this three-candle design. Typically, there is no overlap between the long and short candles. This suggests that a rising trend is about to reverse. This becomes much more important if the third candle surpasses the previous one’s profits.
Conclusion
When analyzing market trends and possible reversals, candlestick patterns can offer insightful information. Candlestick patterns frequently seen are engulfing, shooting star, hammer, and doji. When reading candlestick patterns, it’s critical to consider additional technical indicators. You can trade with candlestick patterns on an excellent trading app like BlinkX. All types of chart patterns with detailed analysis are available. Moreover, there are several such indicators that shall assist you in trading effectively.
Interesting Related Article: “The Pros and Cons of Copy Trading: Is It Right for You?“

