
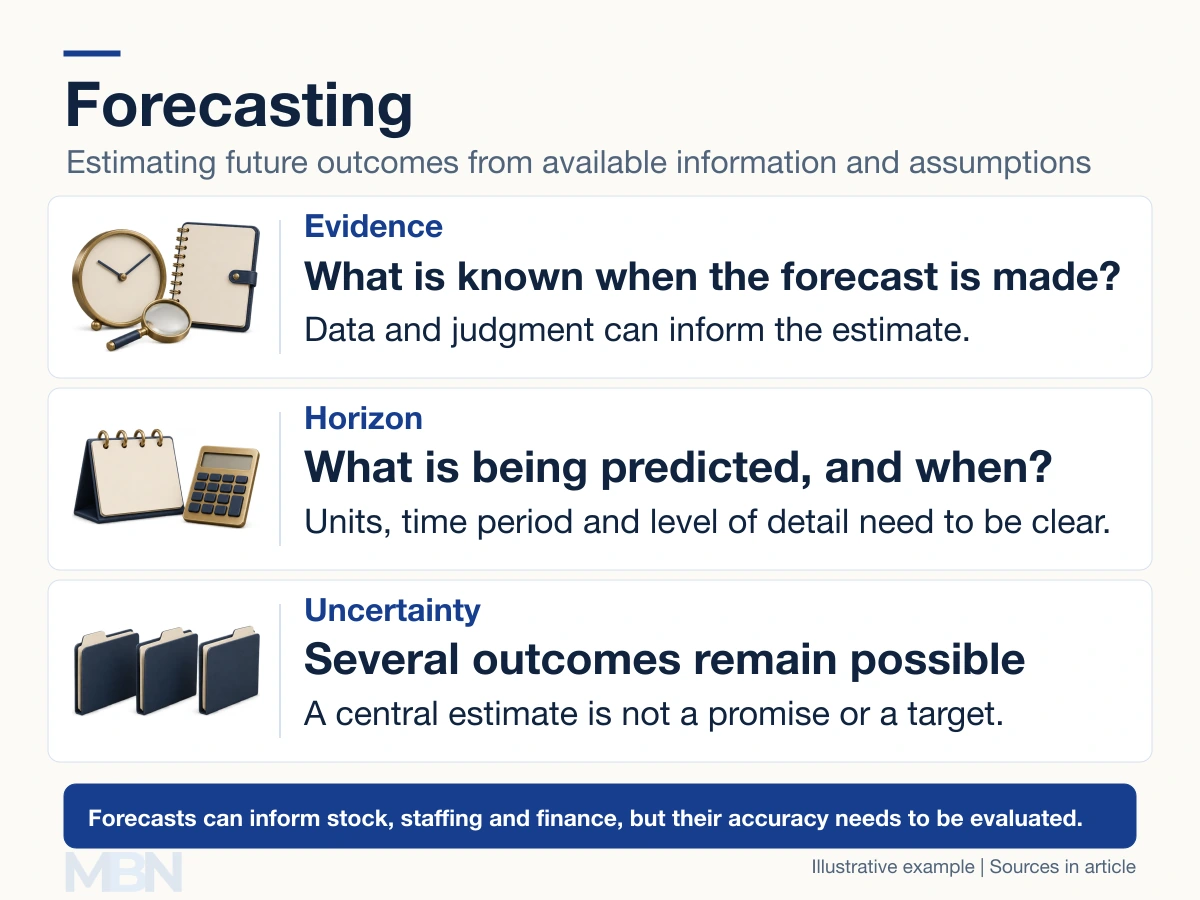
Forecasting estimates future outcomes using information available now, together with a method and assumptions. It can help with planning without determining the future with certainty.
A forecast might concern sales, cash receipts, energy demand or inflation. Its meaning depends on the variable, units, horizon and information available when it was produced.
Methods and information
Quantitative methods use numerical data and a specified model. Judgmental methods use structured expert knowledge or other assessments. They can be combined, and judgment can matter even when historical data exist, as Hyndman and Athanasopoulos explain.
Time-series methods use patterns through time. Models can also use explanatory information, such as planned promotions or prices. A relationship useful for prediction is not necessarily causal, and future values of explanatory variables may themselves be uncertain.
Simple benchmark forecasts
Consider sales of 100, 120, 110 and 130 units in four consecutive months. The forecasting toolbox describes simple benchmark methods that produce different next-month estimates.
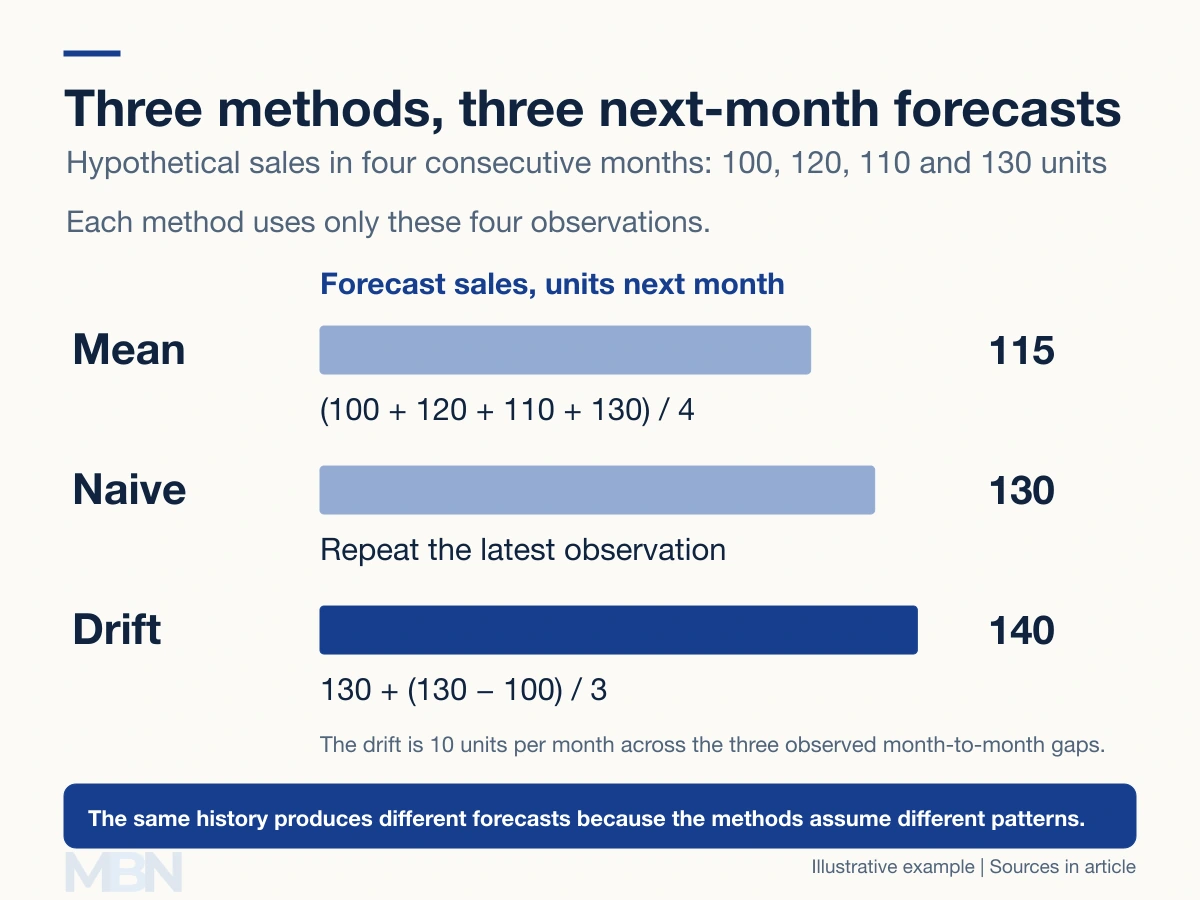
The mean method gives 115 units. The naïve method repeats the latest observation, giving 130. The drift method extends the average change: (130 − 100) ÷ 3 = 10 units per month, producing 140.
The seasonal naïve method instead repeats the latest observation from the corresponding season. If the most recent May had 80 sales, the next May forecast would be 80 under this rule. It does not average all previous May observations.
A mean forecast can miss trends or seasonality. More elaborate methods, including exponential smoothing, regression and machine learning, also need comparison with relevant benchmarks; complexity alone does not establish accuracy.
Checking accuracy
Forecast performance is evaluated against outcomes unavailable when the forecasts were made. Testing only the data used to fit a model can give an overly favorable impression. Comparisons should use the same horizon and information cutoff.
If the next month in the example actually records 126 units, absolute errors are 11 for the mean forecast, 4 for naïve and 14 for drift. Naïve is closest for this one observation, which does not establish that it will always perform best.
Repeated over- or underprediction indicates bias. Average error size and the decision consequences also matter: underestimating demand may create shortages, while overestimating it may leave excess stock.
Uncertainty and scenarios
A point forecast is one central estimate. A prediction interval describes a range with a stated model-based probability. It is not a guarantee that the outcome must stay inside the range.
The Bank of England’s forecasting review examines uncertainty and its communication. Unanticipated shocks, revisions and changing relationships can affect results. Forecasts can become less reliable when the future differs substantially from the conditions used to build the model.
A scenario asks what follows under specified assumptions, such as a delayed shipment. It need not be the most likely outcome. Scenarios help explore consequences that one central forecast can hide.
Forecasts, budgets and targets
A budget is a financial plan; a target is a desired result. A forecast estimates what may happen given current information. Business Queensland distinguishes budgets and forecasts. Either can be detailed, so the distinction is purpose rather than a universal difference in granularity.
Updating a forecast reflects new information. It does not automatically change an approved budget or turn the estimate into a commitment. Useful records retain the forecast date, assumptions and later outcome so performance can be assessed honestly.
Last checked and updated on November 10, 2026 by the MBN editorial team.