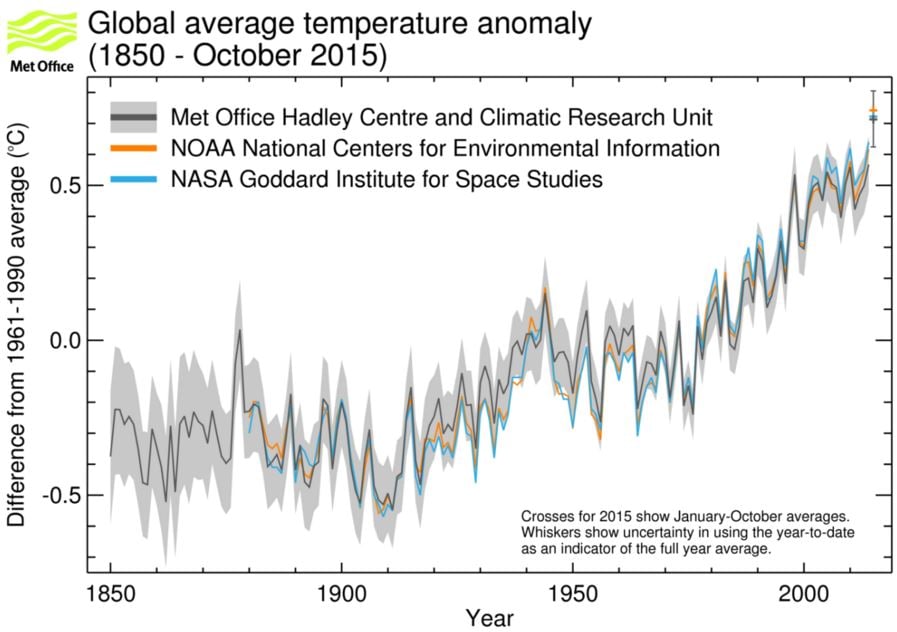
This year – 2015 – is likely to be the hottest year on record, due to a combination of human-induced global warming and a strong El Niño, says the World Meteorological Organization (WMO), an intergovernmental organization with a membership of 191 member nations and territories.
The WMO adds that this year the global average surface temperature will probably reach the ‘symbolic and significant’ milestone of 1°C higher than it was before the pre-industrial 1880-1899 period.
The five-year period of 2011-2015 has been the warmest on record, with several extreme weather events – particularly heatwaves – influenced by climate change, say the authors of a WMO five-year analysis.
 Global annual average near-surface temperature anomalies. (Image: www.wmo.int)
Higher temperatures and levels of greenhouse gases
WMO Secretary-General Michel Jarraud, said:
“The state of the global climate in 2015 will make history as for a number of reasons. Levels of greenhouse gases in the atmosphere reached new highs and in the Northern hemisphere spring 2015 the three-month global average concentration of CO2 crossed the 400 parts per million barrier for the first time.”
“2015 is likely to be the hottest year on record, with ocean surface temperatures at the highest level since measurements began. It is probable that the 1°C Celsius threshold will be crossed. This is all bad news for the planet.”
Mr. Jarraud says that greenhouse gas emissions, which are causing climate change, should and can be controlled. We have the skills and tools to act. While we currently have a choice, future generations will not.
El Niño warming impact likely to continue in 2016
Mr. Jarraud added:
“Added to that, we are witnessing a powerful El Niño event, which is still gaining in strength. This is influencing weather patterns in many parts of the world and fuelled an exceptionally warm October. The overall warming impact of this El Niño is expected to continue into 2016.”
The WMO issued its provisional statement on Earth’s climate in 2015, plus an additional 5-year analysis, to inform negotiations at the COP 21 – the 2015 United Nations Climate Change Conference that will be held in Paris from 30 November to 11 December.
A January-to-October preliminary estimate shows that the global average surface temperature so far this year was about 0.73°C higher than during the 1961-1990 average of 14.0°C, and about 1°C above the 1880-1899 pre-industrial period.
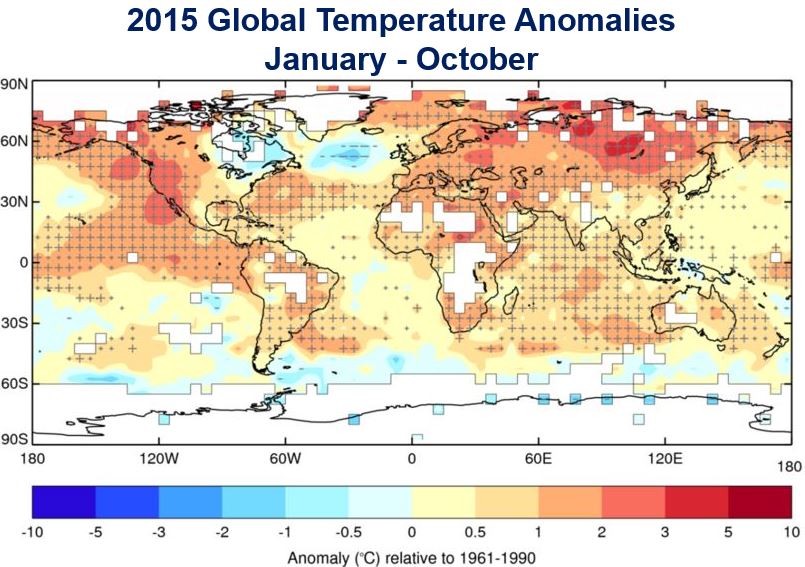
 Average temperature anomalies for the January-to-October period 2015. Crosses (+) indicate temperatures that exceed the 90th **percentile, signifying abnormal warmth, and dashes (-) indicate temperatures below the 10th **percentile, indicating abnormally cold conditions. (Image: www.wmo.int)
** Percentile is the value below which a percentage of data falls. If the temperature is in the 90th percentile, it means it is hotter than 90% of all the places or entities being studied.
2015 likely to be the hottest ever
This temperature tendency suggests that 2015 will most probably be the hottest year on record.
Global average sea-surface temperatures, which hit a record in 2014, are likely to at least equal that record in 2015.
Worldwide average temperatures over land areas just during the January-to-October period indicate that 2015 is likely to be one of the warmest years on record (over land). South America is currently having its hottest year ever, Asia’s temperatures are similar to those recorded in 2007 (a record), while Europe and Africa are heading for their second warmest year.
Preliminary figures for the 2011-2015 period ending in September 2015 show it has been the hottest 5-year period on record – about 0.57°C (1.01°F) higher than the average during the 1961-1990 period (the standard reference period).
It was the hottest 5-year period for North America, South America, Oceania, Europe and Asia. The WMO said the five-year analysis provides a longer-term climate signal than the yearly report.
 Unless we take action now, extreme weather events will occur more frequently, and with more intensity.
2015 Highlights
El Niño: its full effect on global temperatures this year will probably continue after El Niño peaks. Its impacts are already being felt. They started in the North Pacific in 2014 during the summer, and spread to the South Pacific and Indian Ocean this year.
Large areas of the Caribbean and Central America posted below-average rainfall. Brazil, which began 2015 in a drought in its southern and eastern states, saw the drought’s focus shift northwards with very little rainfall during the dry season over the Amazon.
Monsoon rainfall in India was 86% of normal. Indonesia has had significantly more wildfires. Argentina and Peru have been affected with heavy rain and flooding.
 Michel Jarraud, who has been the Secretary-General of the WMO since 2004, says it is not too late if we take action now – a luxury future generations will not have. (Image: unmultimedia.org)
Ocean heat and rising sea level: Our oceans have been absorbing over 90% of the energy that has built up in the climate system from human emissions of greenhouse gases – this has led to rising sea levels and higher ocean temperatures.
From January to September 2015, the global ocean heat content through both the upper 700 metres and 2,000 metres of the oceans posted record-high levels.
The global sea level in the first half of 2015, according to latest estimates, was the highest since 1993 (when satellite observations first became available).
The Tropical Pacific was considerably warmer than average, more than 1°C hotter over large parts of the central and eastern equatorial Pacific, consistent with a strong El Niño year.
Significantly warmer-than-average temperatures were also observed in the north and south Atlantic, the northeast Pacific and large parts of the Indian Ocean.
Colder temperatures, however, were recorded in the far southwest Atlantic and areas to the south of Greenland.
Regional temperatures: most of the observed land areas had significantly warmer-than-average temperatures, especially southern and eastern Eurasia, large areas of South America, and western North America.
For China, the January-to-October period was the warmest on record. This year is Africa’s second-hottest on record. October 2015 was Australia’s warmest ever.
The Antarctic, on the other hand, was notably cold. A strong anomaly in atmospheric patterns (Southern Annular Mode) lasted for several months.
Colder-than-average temperatures were recorded in most eastern areas of North America. Argentina had its coldest October on record, after a warm January-to-September period.
Heatwaves: India had a major heatwave in May and June, with maximum temperatures higher than 42°C, and 45°C in some regions. Temperatures exceeded 40°C in Pakistan in June.
Through the late spring and summer, Europe, the Middle East and Africa were hit by severe heatwaves, with many areas posting new records.
Extremely high temperatures were recorded in May in Morocco, Niger and Burkina Faso. Portugal and Spain also had unusually hot weather.
In July, heat waves affected a large area, from Morocco in the south, to Denmark in the north, and Iran in the East.
Wroclaw in Poland had an all-time high temperature of 38.9°C on August 8. Jordan experienced a heatwave in early August. The heat persevered into September, when it shifted further into Eastern Europe.
Several high-temperature records were recorded in South Africa in the spring of 2015.
Rainfall and drought: Afghanistan, Pakistan, southeast Europe, southern Brazil, Bolivia, Mexico and the USA experienced high rainfall. January’s heavy rains led to flooding in Mozambique, Zimbabwe and Malawi. In February, floods affected Tunisia, Algeria and Morocco.
Exceptional seasonal rainfall totals have been recorded this year in Mali and Burkina Faso.
After unusually heavy rains in March, Chile experienced severe flooding and mudslides. Buenos Aires saw several daily and monthly rainfall records broken in August, while Mexico had its wettest March since 1941, when records began.
The contiguous USA had the wettest May on record and the wettest month overall in 121 years (since records began). From May to October, China had 35 heavy rain events. Seventy-five million people were affected, with losses estimated at $25 billion.
Dry areas included northeast South America, parts of central Europe and Russia, the Caribbean and Central America, Indonesia, southern Africa, and parts of Southeast Asia. In Western North America, long-term drought conditions continue, where basins depend on snow-pack as a water resource. On 1 April, the snow water equivalent was just 5% of normal.
The authors wrote:
“The dry and warm conditions observed across much of the western USA during the year favoured the development of wildfires. In Alaska, over 400 fires burned 728,000 hectares in May, breaking the previous record of 216 fires and 445,000 hectares.”
“Over 700 wildfires were reported in Alaska during July, burning nearly 2 million hectares during the summer. Large fires burned throughout the Northwest in August and Washington State suffered its largest fire on record.”
The report also covers the number and severity of tropical cyclones, and conditions in the Arctic and Antarctic.
Climate Change Attribution
According to several scientific assessments, many extreme events in the 2011-15 period were caused by, or made more severe because of human-induced climate change – in some cases by a factor of 10 or more.
The Bulletin of the American Meteorological Society published 79 studies between 2011 and 2014. More than half of them found that anthropogenic climate change contributed to extreme weather events. Anthropogenic means originating from human activity.
The most consistent influence has been on extreme heat, with some studies finding that the likelihood of an extreme heat event has increased by a factor of at least ten.
WMO Video – The El Niño of 2015-2016
