
An L-shaped recovery describes a sharp fall in economic activity followed by prolonged weakness. On a chart of inflation-adjusted output levels, the economy remains far below its earlier level or path, with little or slow recovery.
The name describes an approximate shape. It is an informal label, not an official recession classification or a promise that output will remain completely flat.
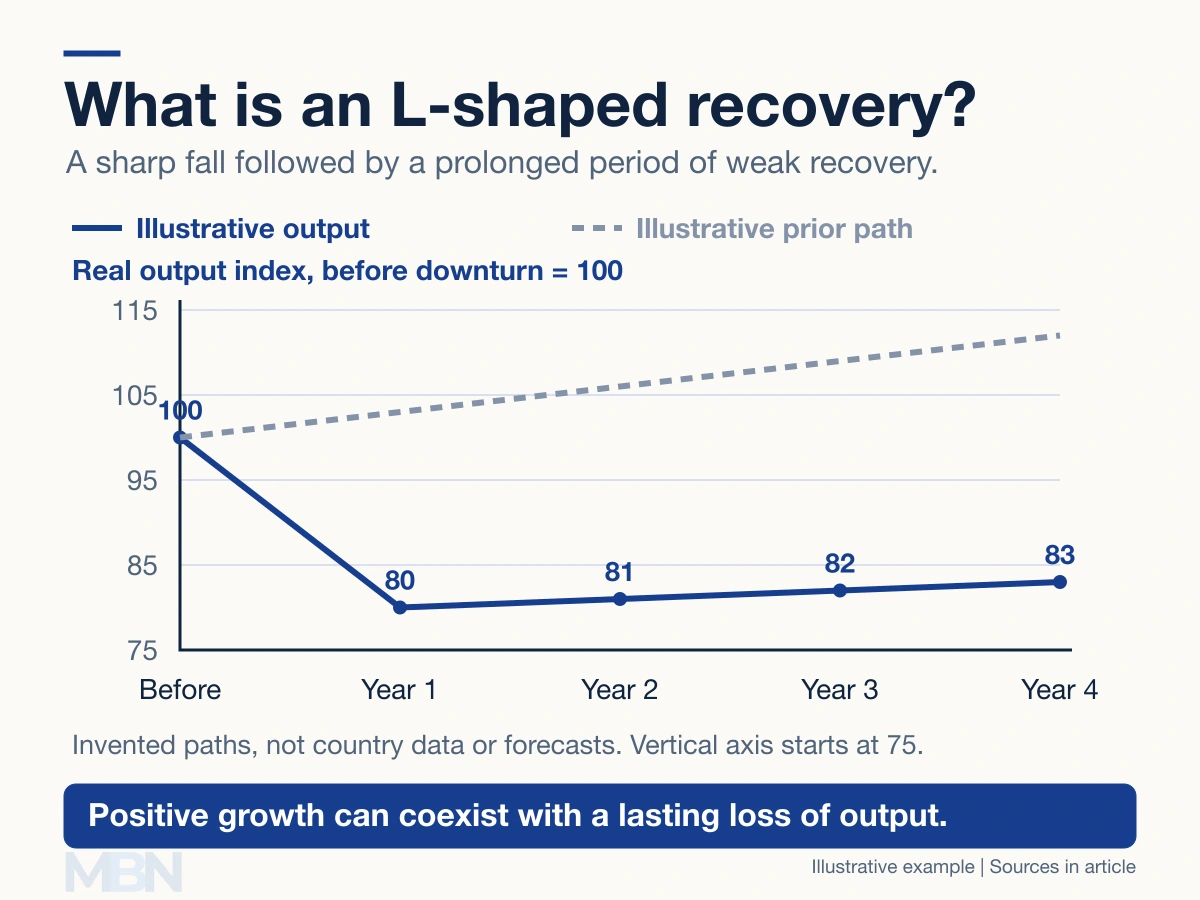
Output can grow while the shortfall persists
Gross domestic product, or GDP, measures an economy’s production. Real GDP adjusts for price changes. A GDP level and its percentage growth rate answer different questions.
Suppose an invented output index falls from 100 to 80, then rises to 81. The first change is a 20% fall; the next is 1.25% growth. Output is growing, yet remains 19% below the starting level.
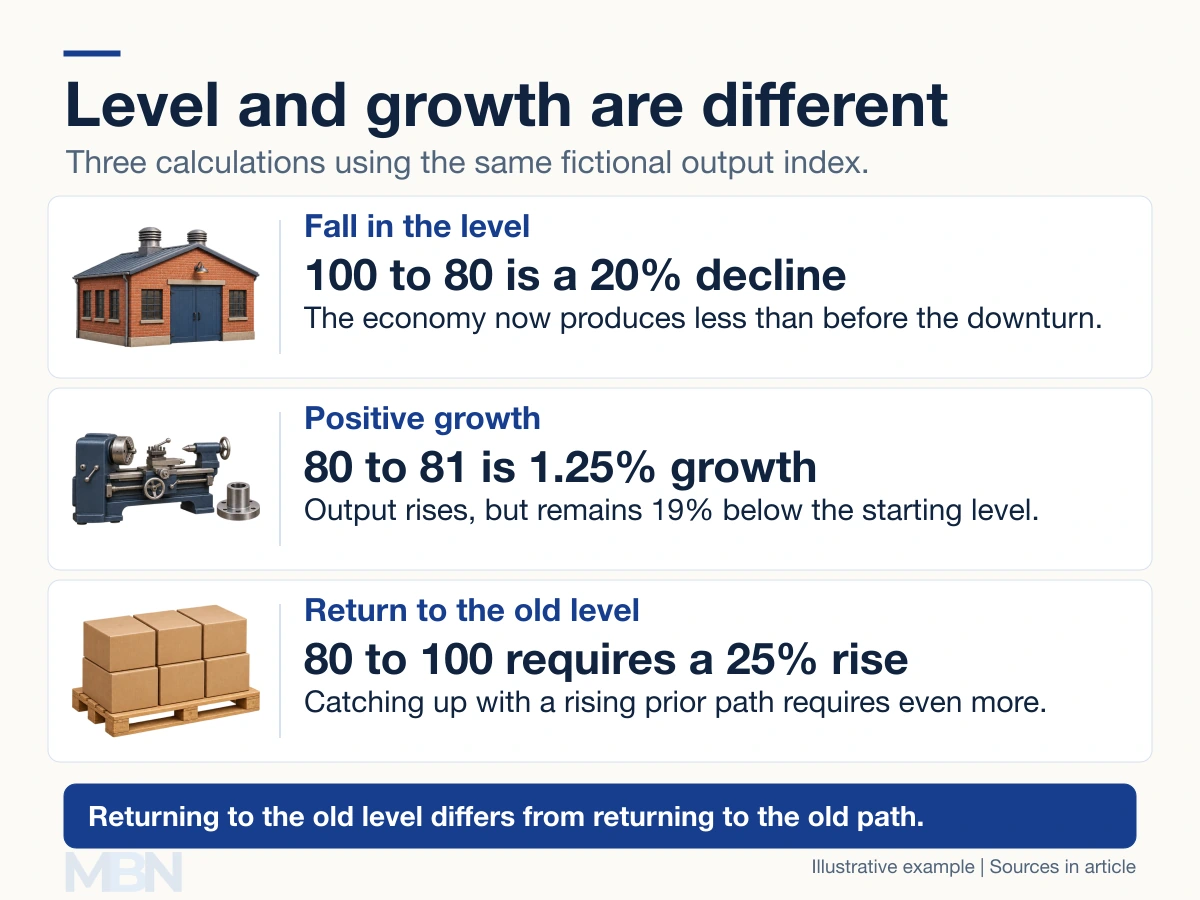
Returning from 80 to 100 requires a 25% increase. Returning to a previous rising path requires more than regaining the old level. The dashed line in the diagram is an invented comparison, not a forecast.
Federal Reserve research on severe recessions documents how output can remain below its pre-recession trend for years. It also finds substantial differences between recovery episodes, rather than one universal shape.
What Japan’s experience illustrates
Japan’s prolonged weakness after its asset-price boom is often discussed in this context. In a 2000 Bank of Japan speech, Kazuo Ueda described stock prices declining from early 1990 and land prices from 1991, followed by serious banking problems.
This was not an uninterrupted period of zero growth. A later Bank of Japan account also distinguished the causes of low growth in the 1990s from those in the 2000s. Japan should not be represented by a literal, permanently flat line.
Other recovery shapes
V-shaped describes a rapid rebound, U-shaped a more prolonged trough before recovery, and W-shaped a recovery interrupted by another downturn. These are descriptive shorthand.
The indicator, time span and comparison matter. A chart of annual growth rates can look very different from a chart of output levels for the same economy.
Last checked and updated on November 2, 2026 by the MBN editorial team.